
 Boomer
 hi
hi Covenant x402
 NEAR Protocol
 Injective
 Quantus
 Solana
- The Honeywell International stock price has broken the Rising trendline and is sustaining below that.
- Honeywell International has signed a deal with GranBio Technologies.
- The HON stock price is trading below the 50-day and 200-day Exponential moving Average.
The Honeywell International stock price has been trading sideways since March 2023. It has signed a deal with GranBio Technologies with the aim of producing carbon-neutral sustainable Aviation fuel. They will combine the ethanol jet technology with Cellulosic Ethanol Avap technology. It can bring some efficiency in the cost.
Honeywell International firm has failed to increase its financial tally over the period of time. Even, it has declined in the last 6 years. The company has done well in the profit aspect as it has slightly increased in the past few years. That could be the reason for the sideways trend in the stock.
Honeywell International’s stock price has declined by over 14% from the year’s high level of $213.78. It is trading close to the year’s low level of $179.13, as the current market price of the stock is $182.27. It signifies that the stock is under the control of bears and bulls have been suffering since the start of this year.
A Glance at the Honeywell International Stock Chart
The HON stock price has created a gap between the price of $203 and $206. It has formed a giant bearish candle on the chart, when the price has declined by over 5% in a single day. The stock price has faced a strong rejection near the psychological level of $200. It has formed 9 red candles out of 10 trading sessions, which indicates that the sellers are aggressively present at that level.
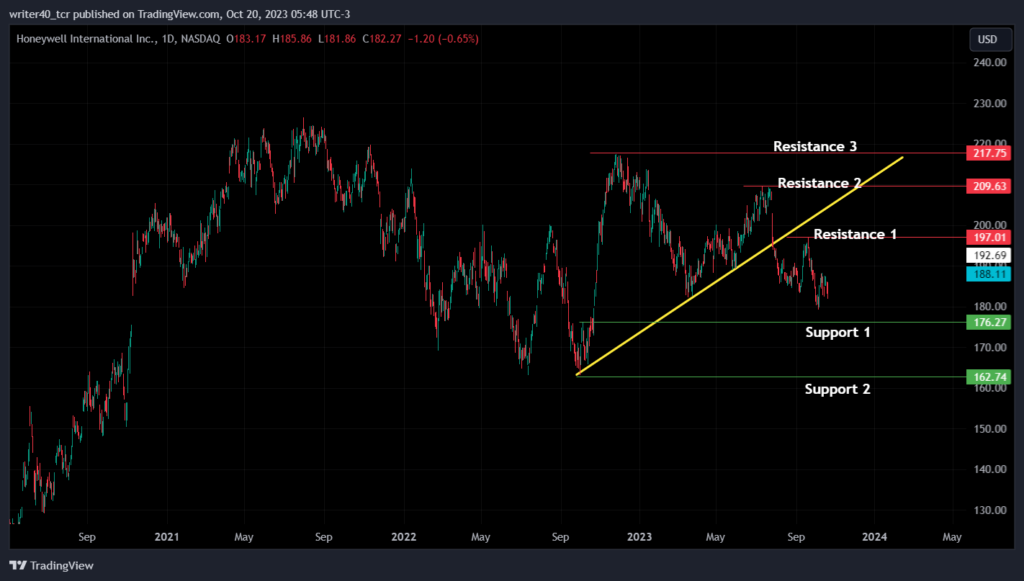
The HON stock price has recently breached the rising trendline which will now act as resistance to the stock. The resistance level for the stock is present at the level of $197.01, $209.63, and $271.75. Considering the support level, it is present at the level of $176.27 and $162.74.
A Quick Glance at the Technical Indicators
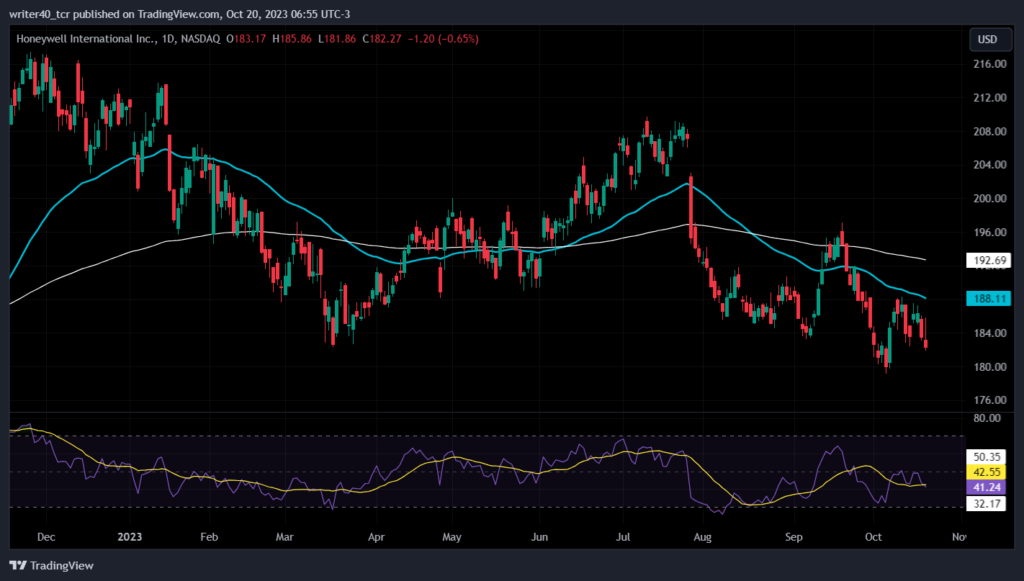
The 50-day and 200-day Exponential Moving Average is currently placed above the current market price of the stock. It seems like the stock price is facing a rejection near the 50-day EMA level. The slope of the EMAs is flat which indicates that the trend of the stock is sideways. The Relative Strength Index is 41.24, which is a bearish sign. Along with it, the slope of the RSI is downward which shows bears are gaining momentum.
Conclusion
The HON stock is currently witnessing selling pressure. However, there are speculations that the stock can beat the market estimation. If this thing happens, it can help to boost the price. If the price rises, it can move towards the level of $197.01 and $209.63. However, if it falls more then it can take support from $176.27 and $162.74.
Technical Level
- Resistance – $197.01 and $209.63.
- Support – $176.27 and $162.74
Disclaimer
The views and opinions stated by the author, or any people named in this article, are for informational purposes only. They do not establish financial, investment, or other advice. Investing in or trading crypto assets comes with a risk of financial loss.




