
 Quack AI
 NEAR Protocol
 Lighter
 Bitway
 Pearl
Pearl Quantus
 Sui
Sui
- MX gave a bullish move after the breakout from the double-bottom pattern.
- The price is trading at $2.573 with a repulse of 1.55% in the last 24 hours.
- The token is just 28.64% away from its all-time high.
MX token price gives a bullish rally gaining 24% after breakout from the neckline of the double bottom pattern. The price is presently getting a decline after it reached the oversold region of the RSI. If the volume rises further it can reach the upward levels of $2.7 to $2.8. The last time the price got bearish was when it was rejected from the resistance level of $2.87 and fell down by 40%.
According to CoinMarketCap Data, the token reached an all-time high on 2nd December 2021, where the value of the token was at $3.70.
The trading volume of the token dropped by 31% in the last 24 hours, with a market capitalization of $257.94 Million. Only a 10% supply of the token is currently circulating in the market which is 100.63 Million MX.
Sentiment Analysis
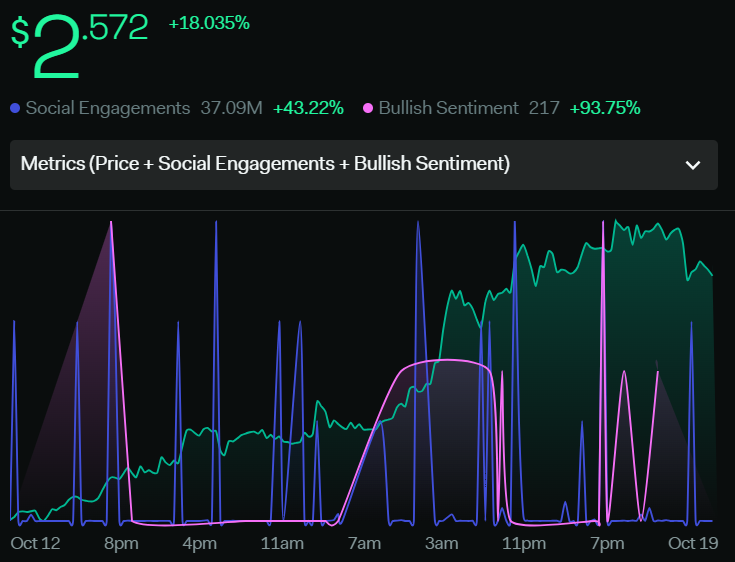
The investors can see a slight increase in the bullish sentiments. Bullish sentiment metrics have surged by 93.75% within a week. The total social engagement metrics have grown by 43.22%. Favoring the bullish sentiments, the volume of the token has also increased by 100.6% in a week.
Technical Analysis Of MX (Daily-1D)
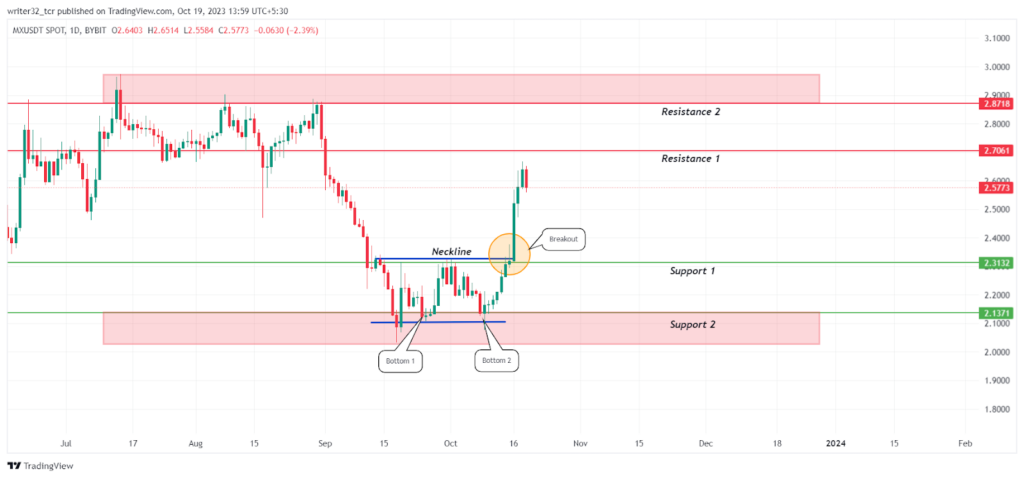
The price is presently making a red candle as it entered the oversold region and the bearish investors started the selling. The short-term traders have also started the selling activity as they have hit their long targets. If the volume keeps on decreasing at this point, the price will start falling and get bearish.
In an opposite scenario, The price can come down to the short-term support level of $2.47 to $2.49 to fill the liquidity of 17th Aug. The token price can take support from and reach the upward level of $2.70 if the volume starts rising at that level.
Indicators On The Price Of MX Token
Relative Strength Index (RSI)
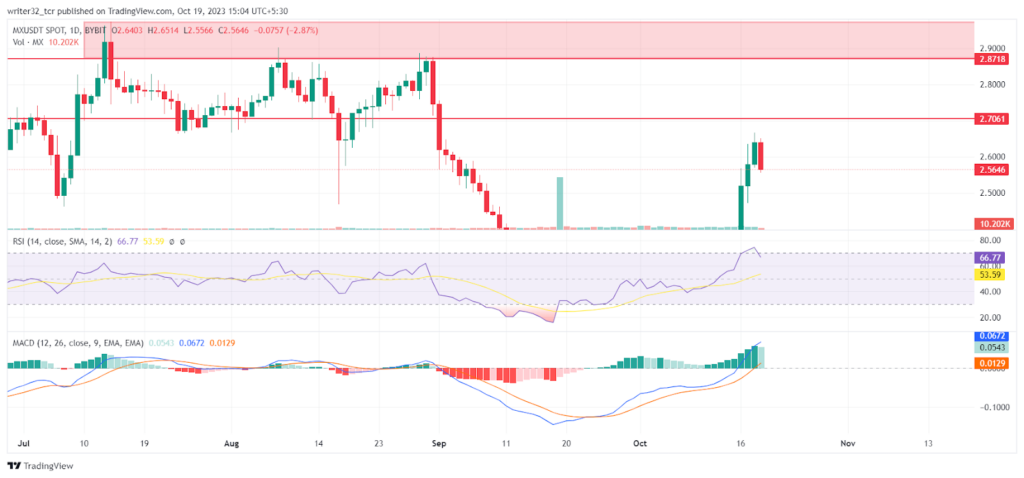
The RSI line is moving at 69.08 points. The SMA 14 is moving at 56.89 points. Both are above the neutral level of 50. RSI entered the overbought region and the price got bearish. It is presently coming down for a correction move.
Moving Average Convergence/Divergence (MACD)
The fast blue line moving average is moving above the red slow line moving average. In the histogram, we can see an immense hike in the volume of the token.
MX LIVE CHART
Conclusion
Presently, The price of the MX token can come a little bit down to fill the liquidity and from there price might take support and give the left a bullish move to $2.70. However, If the price gets below $2.47 to $2.49 it might get bearish and reach a downward support level of $2.31.
Technical Levels
- Support Level: $2.02 to $2.14 and $2.3
- Resistance Level: $2.70 and $2.87 to $2.97
Disclaimer:
The views and opinions stated by the author, or any people named in this article, are for informational purposes only and do not establish financial, investment, or other advice. Investing in or trading crypto assets comes with a risk of financial loss.




