
 Quack AI
 Lighter
 NeoSoul
 Pearl
Pearl Quant
Quant Injective
 Pons
Pons
- GNO had recently broken the bearish trendline and made a lower high on 2nd October.
- The price is trading at $93.6; observing a negative change of 0.54% in the last 24 hours.
- The token lost its value by 25% during the downtrend below the trendline.
The GNO coin price has been trading below the bearish trendline since the mid of July. It was also trading below the 50-day EMA. The price of the GNO coin seems bearish for a short-term timeframe. The price tried to move bullish after breaking out from the bearish trendline but ended up making a lower high and getting rejected from the resistance level of $105. It made a yearly high in the month of April when the token crossed above the 50-day EMA and got an upward move to $146.
The token recorded an all-time high of $1,088.87 on 16 November 2021. It has a present circulating supply of 2.58 Million GNO tokens which is 86.32% of the total supply. The trading volume of the token has surged by 63.50%, with a market capitalization of $242.50 Million in the last 24 hours.
Sentiment Analysis
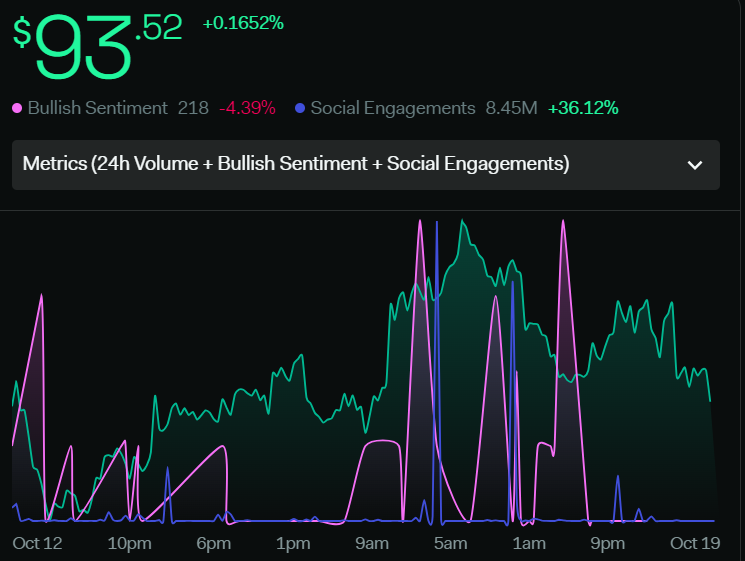
The sentiments of the token show a slightly negative side of the price. The volume of the token dropped by 18.5% within a week, which resulted in a decline of 4.39% in bullish sentiment metrics. Social engagement metrics have an insignificant rise of 36.12% in a week.
Technical Analysis Of the GNO coin (Daily-1D)
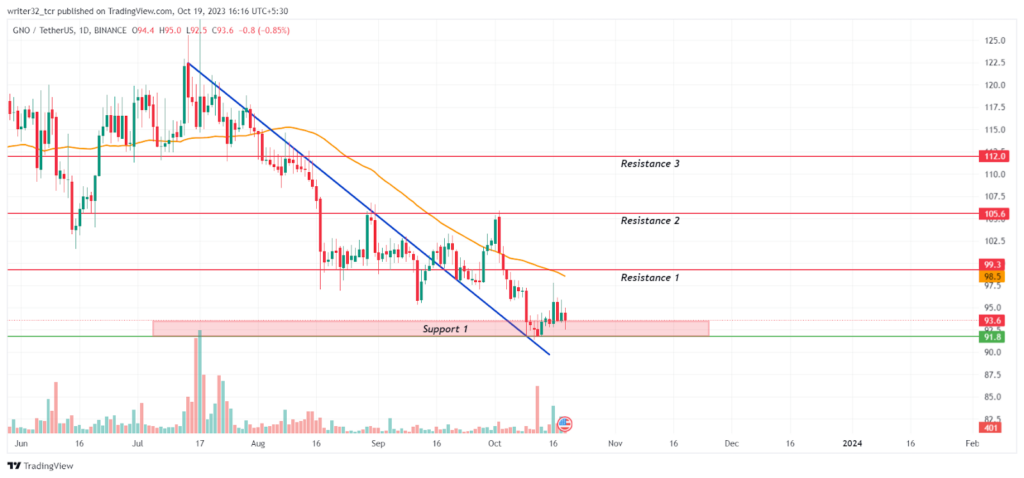
The GNO coin price is presently trading below the 50-day EMA at the support level of $91 to $94. The price will be considered bearish until and unless it gets above the 50-day EMA. Presently the EMA is acting as a resistance for the price. If the price breaks down from this support level, it can reach the downward level of $90 or further below it.
However, If the price takes support from the present level, it can reach $96 easily. Once it breaks above the resistance level of $99.3 successfully, it can target the $105.6 level.
Indicators on the Price of GNO Token
Relative Strength Index (RSI)
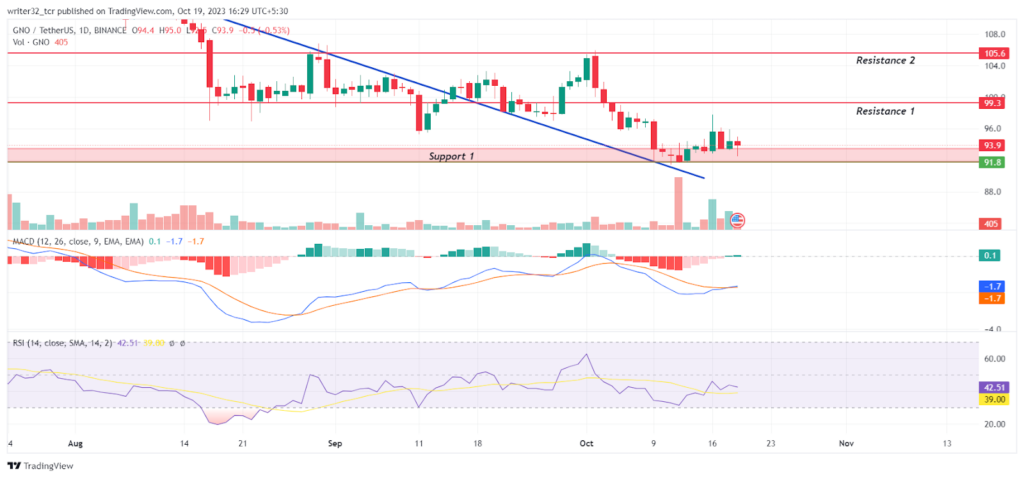
RSI is giving a movement at 42.51 points. SMA 14 is moving at 39.00 points. Both are below the neutral level of 50. RSI is presently under consolidation but the RSI line is moving above the SMA 14 line, which means the bulls are in strength.
Moving Average Convergence/Divergence (MACD)
The fast blue line moving average has given a bullish cross above the red slow line moving average indicating an upward movement in the price. In the histogram, we can see little increase in the volume, which is a positive sign for a bullish move if it increases significantly.
GNO LIVE CHART
Conclusion
The analysis of the GNO coin price represents a bearish movement in the price. If the price takes support from the present position and the volume rises, it can move upside or else it will continue its bearish movement.
Technical Levels
- Support Level: $91 to $94
- Resistance Level: $99, $105, $112
Disclaimer:
The views and opinions stated by the author, or any people named in this article, are for informational purposes only and do not establish financial, investment, or other advice. Investing in or trading crypto assets comes with a risk of financial loss.




