
 Boomer
 hi
hi Covenant x402
 NEAR Protocol
 Injective
 Quantus
 Solana
- Apple, Inc. stock is currently trading at $172.88, with a decline of 1.47% in today’s market session.
- The quarterly profit margin percentage of Apple is declining.
- The RSI for the AAPL is revolving in the neutral region.
Apple Inc.’s stock price is currently moving downward after hitting an all-time high. The price exhibits a pattern of successive lower lows and retractions from resistance thresholds.
The AAPL stock is presently valued at $172.88, showing a decrease of approximately 1.47% in today’s market session. The company boasts a share float of $15.6 billion, with an average trading volume of $53 million.
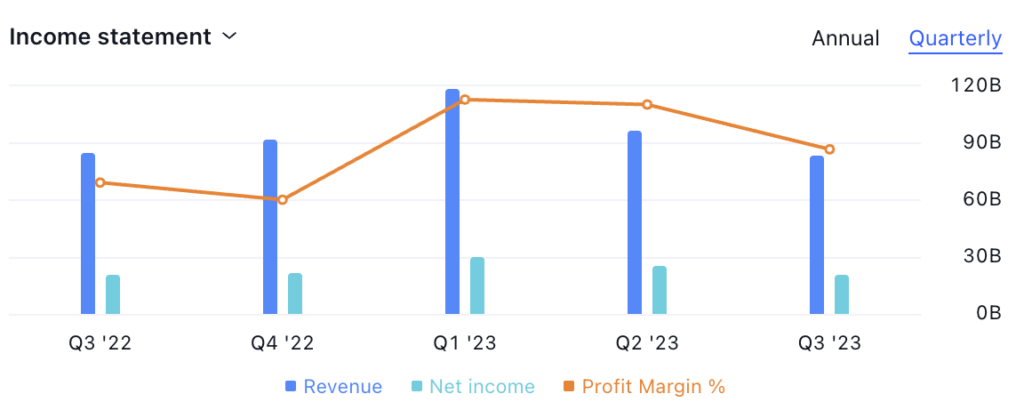
The quarterly profit margin percentage of the AAPL stock has demonstrated a gradual decline. Starting at 25.6% in Q1 2023, it gradually decreased to 24% by the conclusion of Q3 2023. This consistent dip in the company’s financial returns points to weakened and underperforming financials.
In July 2023, the AAPL stock attained its peak at $198.23, after which it transitioned into a descending trend. By mid-August 2023, the stock had experienced a decrease of over 15% and located support around the $170 level. The existing stock price closely aligns with the current support level. It suggests an overarching trend toward descent. If the price breaches the prevailing support, it anticipates further depreciation.

The technical indicators summary by the trading view recommending a sell signal for the AAPL company. Out of the 26 indicators, the majority of them are giving a sell signal. It shows that the stock is likely to experience a downward move.
Apple, Inc. (AAPL) Stock Price Analysis
AAPL by writer50_tcr on TradingView.com
Moreover, the RSI line currently hovers near the 50 level and is positioned beneath the SMA line, signifying a negative view. While the lines reside in a neutral region, the crossing of these lines suggests an emerging descending momentum.
Furthermore, there has been a crossover of the MACD line below the signal line, accompanied by the emergence of a red histogram. Both of these lines also dwell beneath the zero line. When combined, these observations point to a bearish trend in the stock price, underscoring the likelihood of a price decline.
Conclusion
According to the analysis, Apple Inc. stock is exhibiting a bearish trend. The price has shown a negative movement in the previous week. The indicators are also indicating a negative outlook. The earnings of the company have also declined. Hence, if the price has a breakout below the immediate support level, a further decline in the price is expected.
Technical Levels:
- Support Level– $170
- Resistance Level- $197
Disclaimer
The views and opinions of the author or anyone in this article are for informational purposes only. They do not offer financial, investment, or other advice. Investing or trading crypto assets involves the risk of financial loss.




