
 Pearl
Pearl Ondo
Ondo Starknet
 Quantus
 Aerodrome Finance
 Pudgy Penguins
 Akash Network
- The stock price of American Airlines Group has given a negative return.
- American Airlines Group Inc.’s dividend payout history is not impressive because the company has not paid any dividends for the last two years.
- It has a debt of $43.6 Billion and a free cash flow of -$733 Million.
American Airlines Group Inc. (NASDAQ: AAL) functions as a holding company engaged in overseeing a network carrier, primarily through its fully-owned mainline operating subsidiary, American.
The American Airlines Group’s stock is currently on a downtrend, marked by a pattern of progressively lower lows. The stock price has recently broken through a long-standing support level.
Presently, the stock is trading at $11.08, experiencing a decline of -3.23% in today’s market session. The company’s EBITDA has declined by 16% annually, signifying a weakening signal for the stock price.
In the last year, the AAL stock has witnessed a 20% decrease, with a -36% fall in the past three weeks. This substantial decline implies an underperformance of the stock, underscoring the dominance of sellers in the market.
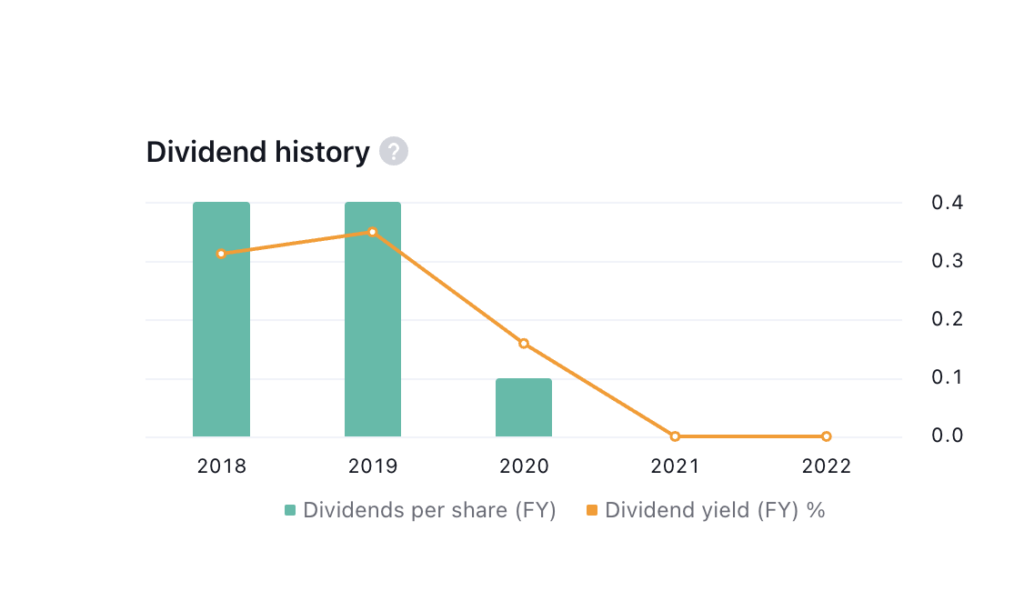
It’s important to note that American Airlines Group no longer offers dividends to its shareholders, a shift that started two years ago. This non-payment of dividends hints at a less favorable financial situation, potentially deterring investors from seeking such sources of income.
The company’s substantial debt of $43 billion coupled with a negative free cash flow of -$733 million are a bearish indicator for the stock price. The company’s insufficient cash to meet its debt obligations is a concerning financial aspect.
In the price history, the AAL stock reached a high of $59.6 in January 2018, following which it underwent a substantial 85% decline. However, it managed to find support at $8.23, triggering a brief recovery. Unfortunately, this recovery was short-lived as the price resumed its descent.
The price pattern has formed a descending triangle, typically signaling a bearish trend. The overall structure of the AAL stock is shaping a bearish pattern. The recent breakdown of a crucial support level reinforces this outlook.
American Airlines Group Inc. (AAL) Stock Price Analysis
AAL by writer50_tcr on TradingView.com
Examining the AAL stock’s MACD and signal lines, both are presently positioned beneath the zero line. Additionally, a red histogram is forming, signaling a bearish sentiment for the stock.
When considering the RSI and the 14-day SMA lines for American Airlines Group Inc. (AAL), they are approaching the 30 levels. It suggests their location within the negative territory and implies a potential for forthcoming price declines.
Conclusion
In conclusion, the AAL stock is moving in a downtrend direction. The price has shown a negative return in the previous also the company does not pay any dividends to its shareholders. The price has recently given a breakout from the important support level. Hence, the price is expected to decline in the upcoming days.
Technical Levels
- Support Level– $8.23.
- Resistance Level- $11.57
Disclaimer
The views and opinions of the author, or anyone named in this article, are for informational purposes only. They do not offer financial, investment, or other advice. Investing or trading crypto assets involves the risk of financial loss.




