
 Dacity Coin
 Celestia
 Quantus
 Bitcoin
 Pearl
Pearl Pons
Pons Injective
- The Canadian National Railway Company stock has fallen as the railway traffic declined.
- The Canadian National Railway Company stock has created a 52-week low level in the previous trading session.
- It has formed a symmetrical triangle pattern on the daily chart.
The stock price of Canadian National Railway Company has fallen by over 13% in the last 6 months. In the previous trading session, the stock price created a low of $104.62, which is also a year-low level for the stock. This fall could be triggered because of the decline in railway traffic by 3.6% this year. This decline has been led by the fall in carloads of grains and metallic ores.
The Canadian National Railway Company stock has been in a downfall since March 2022. The price at that time was $132.96 and after that, the stock price showed a good downfall. Within 3 months, the stock price has shown a decline of more than 27%. However, this decline was halted in June 2022 and since then the stock price has been in a horizontal range.
The Canadian National Railway Company is listed on the NYSE. RBC Bank has lowered the target of the company which is listed on the TSX. It can affect the stock price of CNI, which is listed on the NYSE. However, the stock price is very close to the crucial support level and it will try to breach that level.
A Synopsis of the CNI Stock Chart
CNI stock has formed a symmetrical triangle pattern on the daily chart and is currently trading at the lower level of it. It has tried to breach the pattern on the downside but has failed to do so. Both the upper trendline and lower trendline are inching closer, which indicates that the stock price can show a breakout in the near future. Both the trendlines are tested multiple times, which signifies that it has gotten weaker over time.
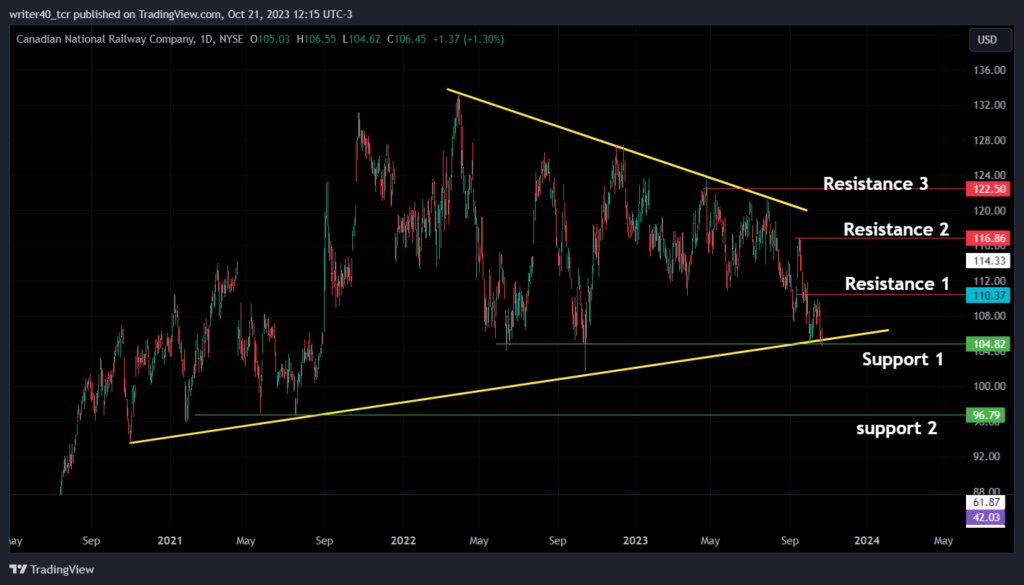
The CNI stock price has been declining sharply and is very close to the trendline support along with the horizontal support. The horizontal support is present at $104.82. Apart from this another support level for the price is present at the level of $96.79. The resistance level of the stock it is present at the level of $110.46, $116.86, and $122.50.
A Short Sight over the Indicator
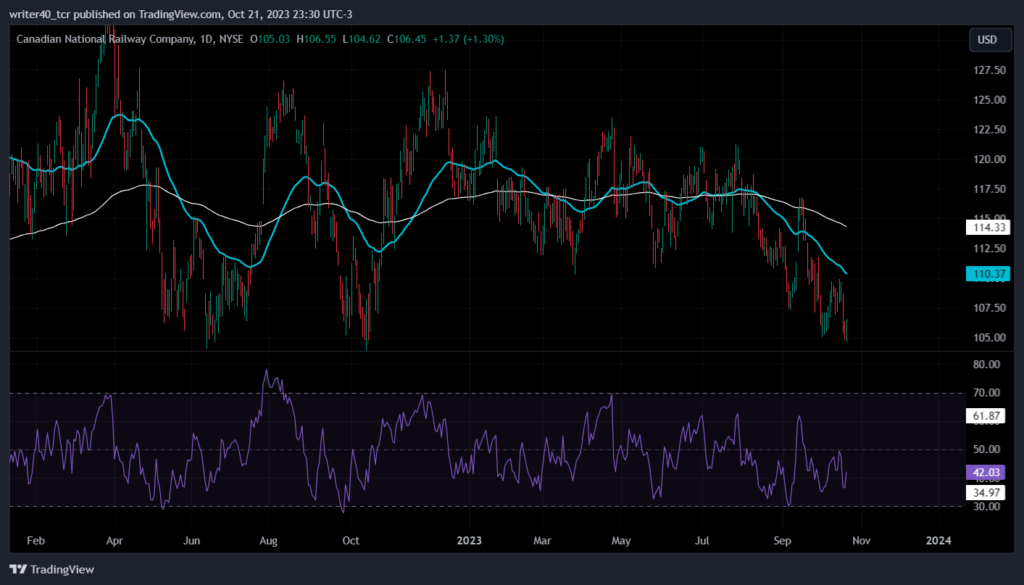
The CNI Stock price is trading below the 50-day and 200-day Exponential Moving Averages. It recently faced a rejection near the 50-day Exponential Moving Average. That’s a bearish sign for the stock. Considering, the Relative Strength Index is also showing the same sentiment, as it is currently curving below 50, showing that the momentum is favoring bears as of now.
Conclusion
The CNI stock price has been in a strong downtrend and several negative re-ratings have created more pressure on it. However, if the stock price gives a breakdown on the lower side and breaks the support level of $104.82, it can try to achieve the level of $96.79. On the other hand, if the price rises, it can move to the resistance level of $110.46 and $116.86.
Technical level
- Resistance – $110.46 and $116.86
- Support – $104.82 and $96.79
Disclaimer
The views and opinions stated by the author, or any people named in this article, are for informational purposes only. They do not establish financial, investment, or other advice. Investing in or trading crypto assets comes with a risk of financial loss.




