
 Pearl
Pearl Ondo
Ondo Starknet
 Quantus
 Aerodrome Finance
 Pudgy Penguins
 Akash Network
- The HCA share price is trading at $241.13 with a decline of 1.2%.
- The company is planning to collaborate with other healthcare companies to aim for the enhancement of cancer care through early detection.
HCA Healthcare (NYSE: HCA) is a health service-based company. It mainly operates hospitals, surgery centers, and emergency and urgent care units. The firm aims to provide high-quality patient-care centers. It was established by Dr. Thomas F. First, Jr in 1968.
HCA Healthcare Plans for a Collaboration
On 17 October 2023, it was reported that HCA Healthcare (HCA), the Sarah Cannon Cancer Institute, and Illumina’s Grail (ILMN) plan to collab. The collaboration of the healthcare institute will focus on the improvement of cancer care through early detection.
HCA Healthcare (HCA) Stock Analysis
HCA Healthcare has declined by 1.2% and closed its last intraday session at $241.13. The company stock tarded with a 24-hour trading volume of 1.66 Million. HCA is among the large-cap healthcare service centers with a market capitalization of 65.5844 Billion USD.
Price Movement Analysis of HCA Stock on a 1-Day Timeframe
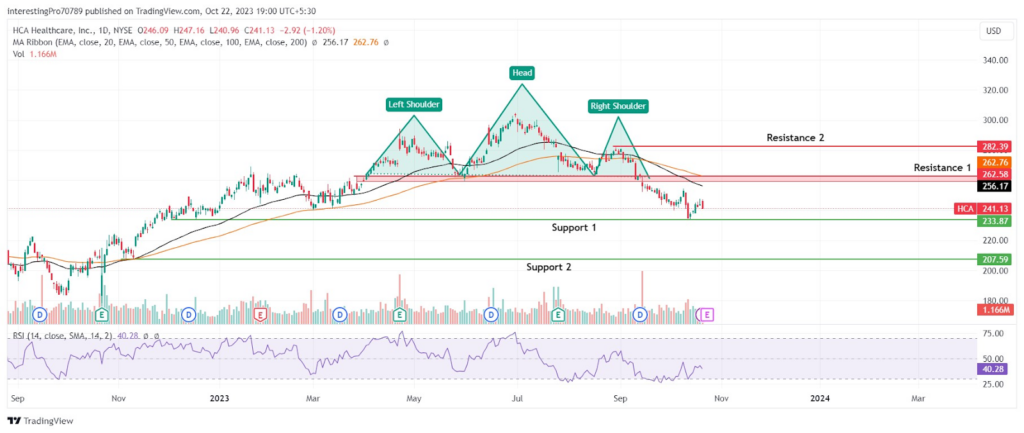
The HCA company has recently given a breakdown head and shoulder pattern. The stock price is trading with a support of $233.87 and with a resistance zone of $262.58. Currently, the price is approaching to retest its 233.87 support.
The 50-day EMA and 200-day EMA lines are trading above the price showing the bears full control over the price.
The relative strength index is at 40.28 which is a bearish territory. The RSI line is sloping in the downward direction, showing the ongoing selling pressure applied by the sellers.
In the current scenario according to the price movement, the price is approaching the $233.87 support. The price has a high chance of breaking below the $233.87 support. If it gives the breakdown of this support level, it may fall to its next support at $207.59.
However, for the price to be in bullish sentiment, it should reclaim the $268.58 resistance level and have to sustain above it. After that, the price may rise to its next resistance at $282.39.
Conclusion
The overall trend and future prediction of the HCA stock are bearish. Technical indicators are pointing towards the fall in price. However, traders should wait for the breakdown of the $233.82 support level. After that, the price may continue its fall and can fall to its next support at $207.59. However, for a bullish market, the price has to reclaim the $268.58 resistance. Thus, it may rise to its next resistance at $282.39.
Technical levels
- Resistance Levels: $268.58 and $282.39.
- Support Levels: $233.82 and $207.59.
Disclaimer
The views and opinions stated by the author or any other person named in this article are for informational purposes only. They do not provide financial, investment, or other advice. Investing or trading in crypto comes with a risk of financial loss.




