
 Minter
 Sui
Sui Pons
Pons NEAR Protocol
 Starknet
 Quack AI
 Chainlink
- TransUnion announced its Q3 report, resulting in a loss for the quarter.
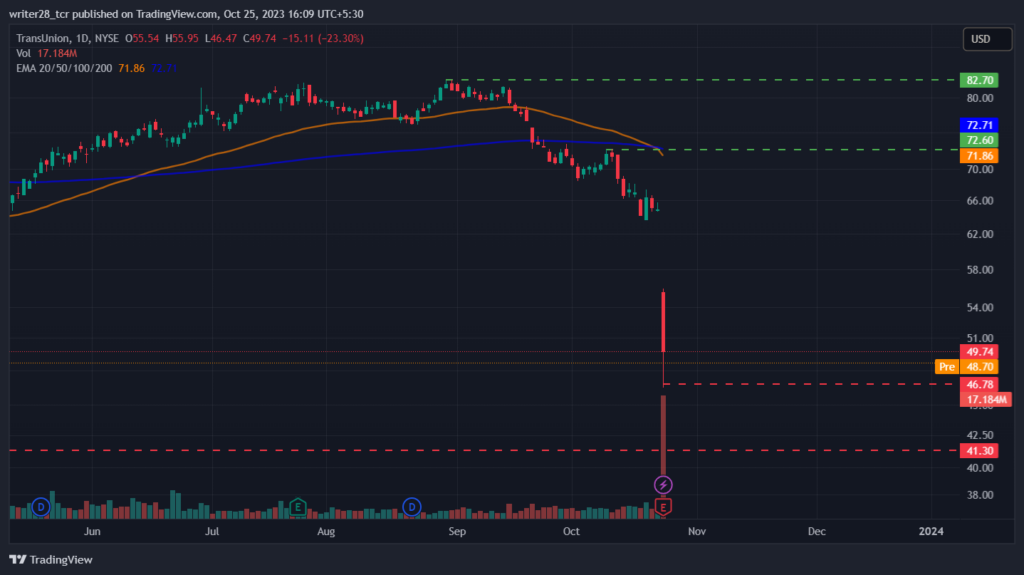
- TRU stock price slid 23.30% in the past intraday session and was closed at $49.74.
- TRU stock price is currently trading at a six-year low.
TransUnion (TRU) is one of the three main credit bureaus that prepare credit scores. That helps the credit card seekers to determine whether they will or won’t get the new credit card they applied for.
Currently, TransUnion is facing a challenge getting credit from its shareholders. TRU stock witnessed a mass sell-off after the company missed analyst predictions for the third-quarter revenue and earnings.
TransUnion announced its third-quarter financial report on Oct 24, 2023, resulting in a loss of 4.21% EPS, according to the Zacks report. The reported EPS of $0.91 failed to meet the Zacks consensus estimate of $0.95 EPS.
The earnings outcome developed a bearish sentiment in the market. Hence, the price melted by about 23.30% within a day. The Q3 report assisted the downtrend momentum, and the price reached the annual low at $46.47.
However, the news wasn’t all bad. TransUnion actually did manage to grow its revenue by 3.3%. The company reported revenue of $968.7 Million, up 3.3% over the same period last year, even though it failed to meet the estimated revenue forecast of $982.9 Million.
Currently, TRU stock price was closed at $49.74 while witnessing a massive loss of 23.30% in the previous intraday session, with the highs and lows of $55.95 and $46.47 respectively. Moreover, the market capitalization of TransUnion is $9.61 Billion, and the average trading volume is 3.1 Million.
TRU Stock Showcasing A Death Cross Pattern.
TransUnion (TRU) stock price recently showcased a death cross pattern on Oct 23, 2023. The short-term moving average 50-day EMA crossed below the long-term moving average 200-day EMA, which indicates vigorous weakness in the price action. However, the analyst rating suggests that it is good to buy the share, but investors should wait for the next move.
The Relative Strength Index (RSI) and Chaikin Money Flow (CMF) are trading below the 50-neutral zone and 0 mark, respectively. Whereas the RSI is at 15.64, denoting a sudden mass accumulation of sellers over the past few days. However, The CMF scored at -0.20, suggesting bearish dominance in the market.
If the current bearish sentiment sustains, the price might melt and retest the significant support level of $41.30. On the contrary, if the bulls snatched control from the bears, the price might surge above the previous candle’s high of $55.95.
Conclusion
TransUnion’s market structure and price action suggest that stock prices might face a relief rally soon. If the potential upcoming correction phase occurs, the price might recover from the prior losses. However, the technical parameters favor the seller’s side, but the market analyst suggests good buying opportunities.
Technical Levels
- Major resistance: $81.72 and $82.67
- Major support: $46.47 and $56.92
Disclaimer
The views and opinions stated by the author, or any people named in this article, are for informational purposes only. They do not establish financial, investment, or other advice. Investing in or trading crypto assets comes with a risk of financial loss.




