
 Pearl
Pearl Bitcoin
 NEAR Protocol
 Starknet
 Solana
 Quant
Quant Ondo
Ondo
- The CVE price is currently trading at $19.54.
- The price is currently taking support from the 100-day EMA and ascending trendline.
Cenovus Energy Inc. (NYSE: CVE) is an integrated oil and gas company. The firm deals in the exploration, development, and sales of crude oil, natural gas liquids (NGL), and Natural gas. It runs its operations through four segments: Oil sands, Deep Basin, Refining & Marketing, and Corporate & Elimination.
Cenovus Energy Inc. Stock Analysis
The CVE stock price opened at $19.49 with a decline of 1.26% in its last intraday session. However, it managed to recover the decline by 0.54% on the same trading day and closed at $19.54. It is a mid-cap organization with a market capitalization worth 37.152 Billion USD.
Price Analysis of CVE Stock on a 1-Day Timeframe
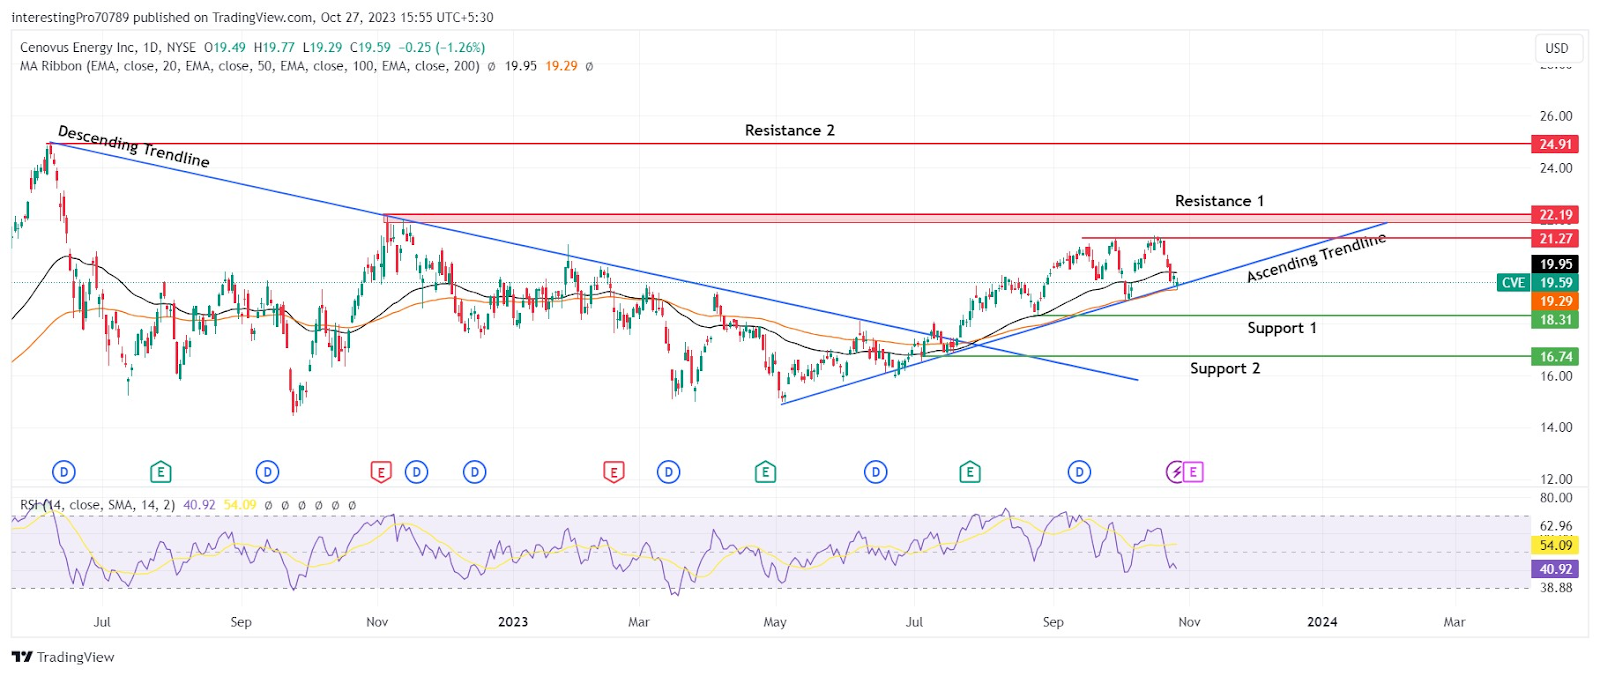
After a continuous downtrend with a resistance of a descending trendline, the price gave the breakdown of the descending trendline at the end of July 2023. After this, it started its uptrend with the support of an ascending trendline. Recently, it failed to give the breakout of the $21.27 level and started to fall. It is currently taking support from the ascending trendline.
Recently, the price has broken below the 50-day EMA and it is taking support from the 100-day EMA. It shows the sellers tried to drag the price down but buyers didn’t let it fall further.
The relative strength index has crossed below its 50 level and is currently at 40.92, which is marked as bearish territory. The RSI line is sloping in the downward direction, which shows the selling pressure being applied by the sellers.
In the current scenario, the sellers are seen taking control of the price from buyers. If the price can’t sustain above the ascending trendline support and closes below it, it may fall to its next support at $18.31. For the continuation of the fall, it should then give the breakdown of $18.31 support. After that, the price can fall to its next support at $1674.
However, as long as the price is sustained above the strong support level of $18.31 level, the buyers will continue to influence the price. In the current scenario, if the price forms a strong bullish candle by taking support from the 100-day EMA and ascending trendline and engulfs the current candle, it may again rise to retest the $21.27.
If the price gives a breakout of $21.27, it will rise to its immediate resistance at $22.19. For the continuation of the bull trend, it must close above this level also. After that, it may rise to the next resistance at $24.91.
Conclusion
The overall trend of the CVE stock is bullish. The price is currently taking support from the 100-day EMA and ascending trendline. However, the technical indicators mentioned above are giving mixed signals. So, it would be better to wait for the breakout of the $22.19 level as it has no obstacle in between. The stock price could easily rise to its next resistance at $24.91. Suppose it fails to sustain above the current acting supports, it may fall to its next support at $18.31 in the upcoming trading session.
Technical levels
Resistance Levels: $21.27, $22.19 and $24.91.
Support Levels: $18.31 and $16.74.
Disclaimer
The views and opinions stated by the author or any other person named in this article are for informational purposes only. They do not provide financial, investment, or other advice. Investing or trading in crypto comes with a risk of financial loss.




