
 Quack AI
 Lighter
 NeoSoul
 Pearl
Pearl Quant
Quant Injective
 Pons
Pons
- Fiverr International Ltd. price is trading near an all-time low.
- The FVRR stock price has given a return of negative 23% in the previous year.
- Fiverr International Ltd. (FVRR) has a debt of $462 Million.
Fiverr International Ltd. operates an e-commerce platform designed for the exchange of digital services, enabling individuals to both purchase and offer a wide range of digital services.
The price of Fiverr International Ltd. (NYSE: FVRR) is on a downtrend with lower lows being established in the weekly timeframe.
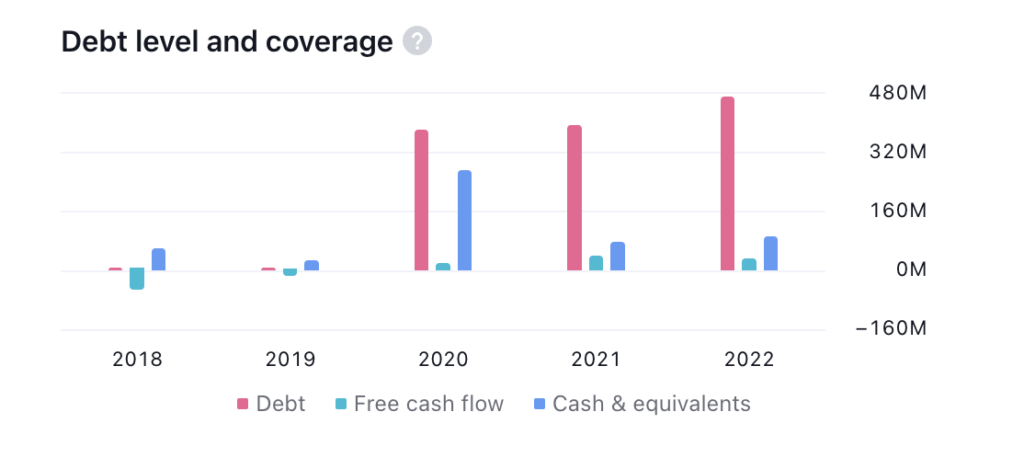
In the current market session, FVRR stock is trading at $22.15, reflecting a 7.9% decline in today’s market session. The company has a debt of $462 Million and a Free Cash Flow of $28 Million. This is a poor sign and the company does not have enough cash to repay its debt.
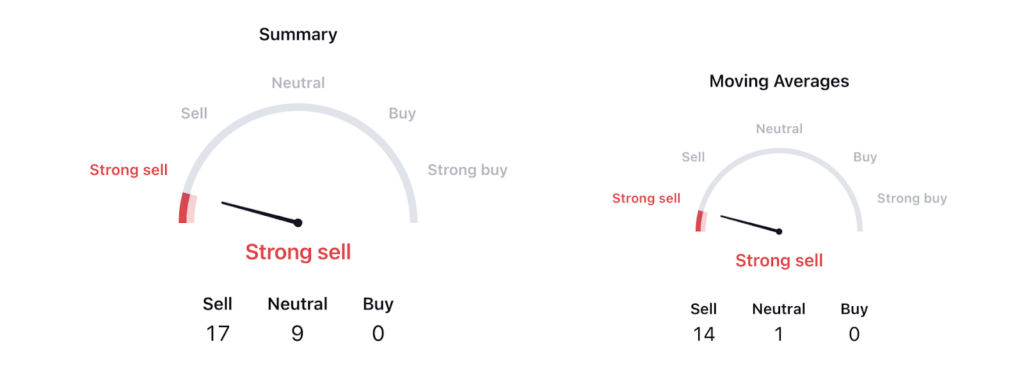
The technical indicator summary by the trading view recommends a strong sell for the FVRR stock. Out of the 26 indicators, 7 suggest a sell signal. The moving averages summary indicates a strong sell for the stock. Thus, it is indicating a potential weakness in the stock.
Fiverr International Ltd. has given a return of negative 23% in the previous year, implying a weak performance by the company in the past year. Thus, buyers might feel less confident in investing due to the poor return.
In the year 2021, FVRR stock achieved its highest point, reaching $336, but subsequently embarked on a downward trajectory. The price witnessed a significant decrease of almost 94%.
However, it managed to discover a critical support level at $18.1. At present, the price is hovering close to its historical low. Recently, it experienced a breakout from a descending triangle pattern which implies a frail structure. Consequently, there is an anticipation of further price declines in the days ahead.
Fiverr International Ltd. (FVRR) Stock Price Analysis
FVRR by writer50_tcr on TradingView.com
In the weekly timeframe for Fiverr International Ltd., the MACD line is positioned beneath the signal line which signals a bearish trend. This indication is reinforced by the appearance of red histograms.
The overall market momentum for Fiverr International Ltd. appears to be weak as indicated by the current arrangement where the 14-day SMA line is above the RSI line. This configuration suggests the potential for a future decline in the stock’s price.
Conclusion
FVRR stock is moving downwards. The price has given a breakdown from the descending triangle pattern, indicating a weakness in price. The company has given a negative return in the previous year. The indicators are negative for the stock and the technical summary also suggests a strong sell. Hence, the price is expected to decline more.
Technical Levels
- Support Level- $18.10
- Resistance Level- $25.10
Disclaimer
The views and opinions of the author, or anyone named in this article, are for informational purposes only. They do not offer financial, investment, or other advice. Investing or trading crypto assets involves the risk of financial loss.




