
 Quack AI
 Bitcoin
 Lighter
 Injective
 Pearl
Pearl Zcash
Zcash Sui
Sui
- The D share price is currently trading at $40.97.
- The company is scheduled to report its Q3 earnings report on 3 November 2023.
Dominion Energy Inc. (NYSE: D) is a natural energy and gas supplying company. The firm deals in the production, transmission, and distribution of electricity and natural gas. It operates through four segments: Dominion Energy Virginia, Gas Distribution, Dominion Energy South Carolina, and Contracted Assets.
Q3 Earning Expectation
As the D company decided to report its Q3 earnings on 3 November 2023, the analysts are expecting Dominion Energy to post $0.79 earnings per share much higher than the previous Q2 result. They are expecting growth in the revenue by $4.38 Billion which is also more than its prior Q2 result.
Dominion Energy Inc. (D) Stock Analysis
In the last trading session, the Dominion share price opened at $40.46 and closed at 40.97 with a gain of 1.06%. D company is a mid-cap energy manufacturer with a market capitalization of 34.283 Billion USD.
D Stock Price Analysis on 1-Day Timeframe
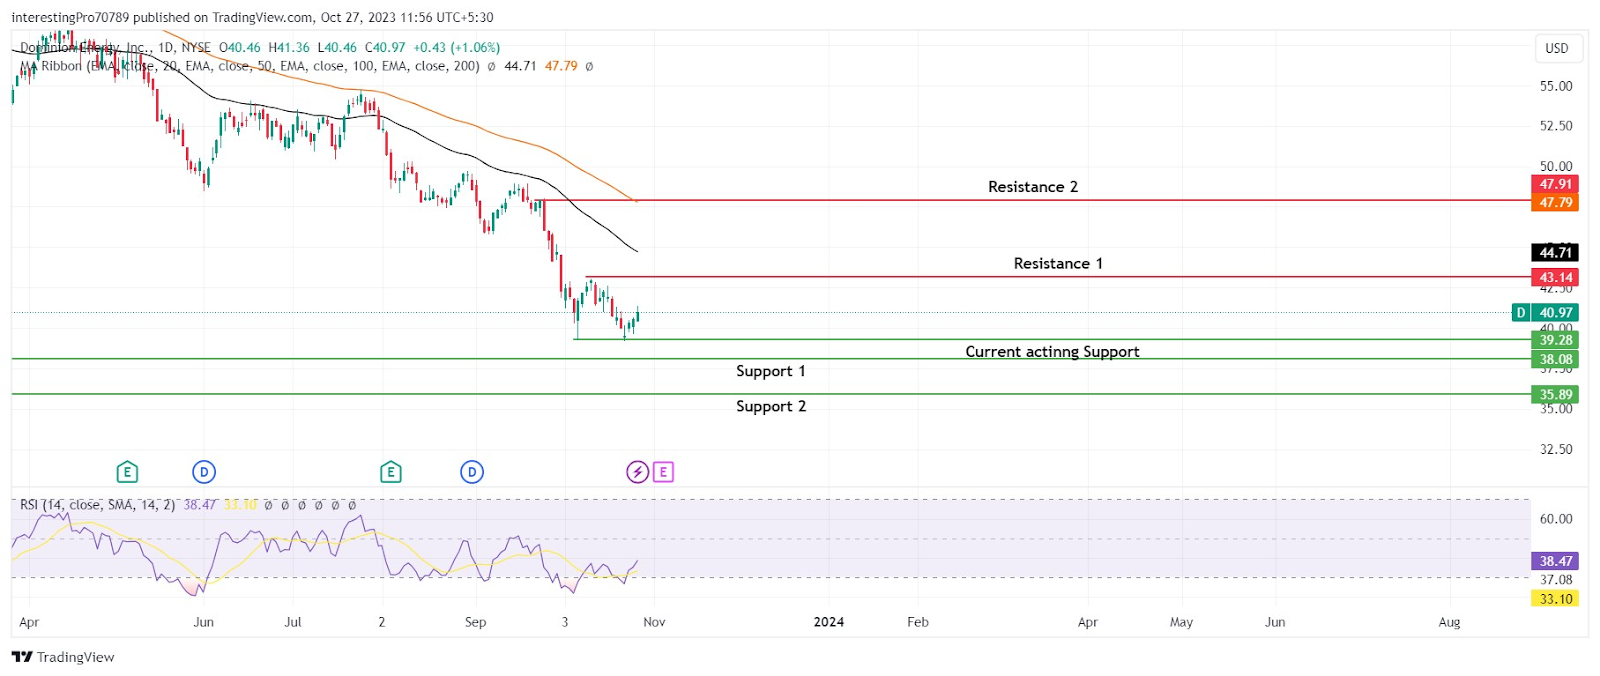
In the wider outlook of the 1-day timeframe of D Stock, it shows the company share price has been falling since mid-August 2022. Currently, it has formed it new support of $39.28 and resistance of $43.14 and is trading between these two levels. In the last four trading sessions, the price has increased by 3.97%.
The 50-day and 100-day EMA lines are trending in the downward direction and above the price which indicates the absolute dominance of the bears. However, The EMA lines are far from the price due to which the price is rising to retest them.
The relative strength index has recently come out of the over-sold territory and is at 38.47 which is marked in bearish territory. It shows ongoing buying pressure as the price is in the recovery phase.
The overview chart shows the price is under complete control of the sellers. However, the price is rising due to the ongoing recovery phase. As long as the price is below the EMA lines and $43.14 resistance the seller will dominate and it may fall to its $39.28 support. If the price gives the breakdown of $39.28 support then it will fall to its next support at $38.08. However, for the continuation of this downtrend momentum, it must close below the $38.08 support. After which it may fall to its next support level at $35.89.
Buyer can take control of the price if they close the price above the EMA lines and the $43.14 resistance level. After which the price may continue its uptrend to its next resistance at $47.91.
Conclusion
The overall trend of the D stock price is a downtrend. In the current scenario, the price is rising as it is in the recovery phase. However, the chances are high for the continuation of the downtrend as long as the price is trading below the EMA lines and the $43.14 resistance level.
Technical levels
Resistance Levels: $43.14 and $47.91.
Support Levels: $39.28, $38.08 and $35.08.
Disclaimer
The views and opinions stated by the author or any other person named in this article are for informational purposes only. They do not provide financial, investment, or other advice. Investing or trading in crypto comes with a risk of financial loss.




