
 Injective
 Bitcoin
 Quantus
 Sui
Sui Derive
 Pump.fun
 Quant
Quant
- The RTX Corporation stock price has declined by over 20% in the last 6 months.
- Citigroup maintains its previous rating of “NEUTRAL” on the RTX Corporation stock price.
- The company has beaten the market estimate on earnings and revenue.
The RTX corporation stock price has escalated by over 6% in a week after the company reported its financial report. It has surpassed the Wall Street estimate on earnings and revenue by about 5%, which is a positive thing for future growth. The RTX stock price has also reacted positively as it has surged by over 7% on the day and formed a gap on the chart.
RTX Corporation stock’s price has been in a sideways to downward trend since April 2022. The price has formed a multiple-swing high near the level of $100 but has failed to clear that level till now. After April 2023, the stock price started to decline from the same resistance level. It melted down by over 30% from the highs. However, the price has recovered from the lower levels in October.
Citigroup has recently released its statement on the RTX stock price, in which it has maintained its previous rating of “NEUTRAL” on the stock. However, it has slightly raised the target price of the stock from $82 to $87. It indicates that the firm’s outlook on the stock is still positive. It expects that the company will deliver the same performance ahead.
A Quick Glance Over the RTX Corporation Stock Chart
The recent behavior of the RTX stock price is quite noteworthy. It has shown a V-shape recovery on the daily chart and surged by over 15% in October itself. The stock price after a big gap-up is currently trading flat and is showing very little volatility in the price. It has formed some gaps in the daily chart on both sides and it will be interesting to watch, what will be the direction of the stock ahead.
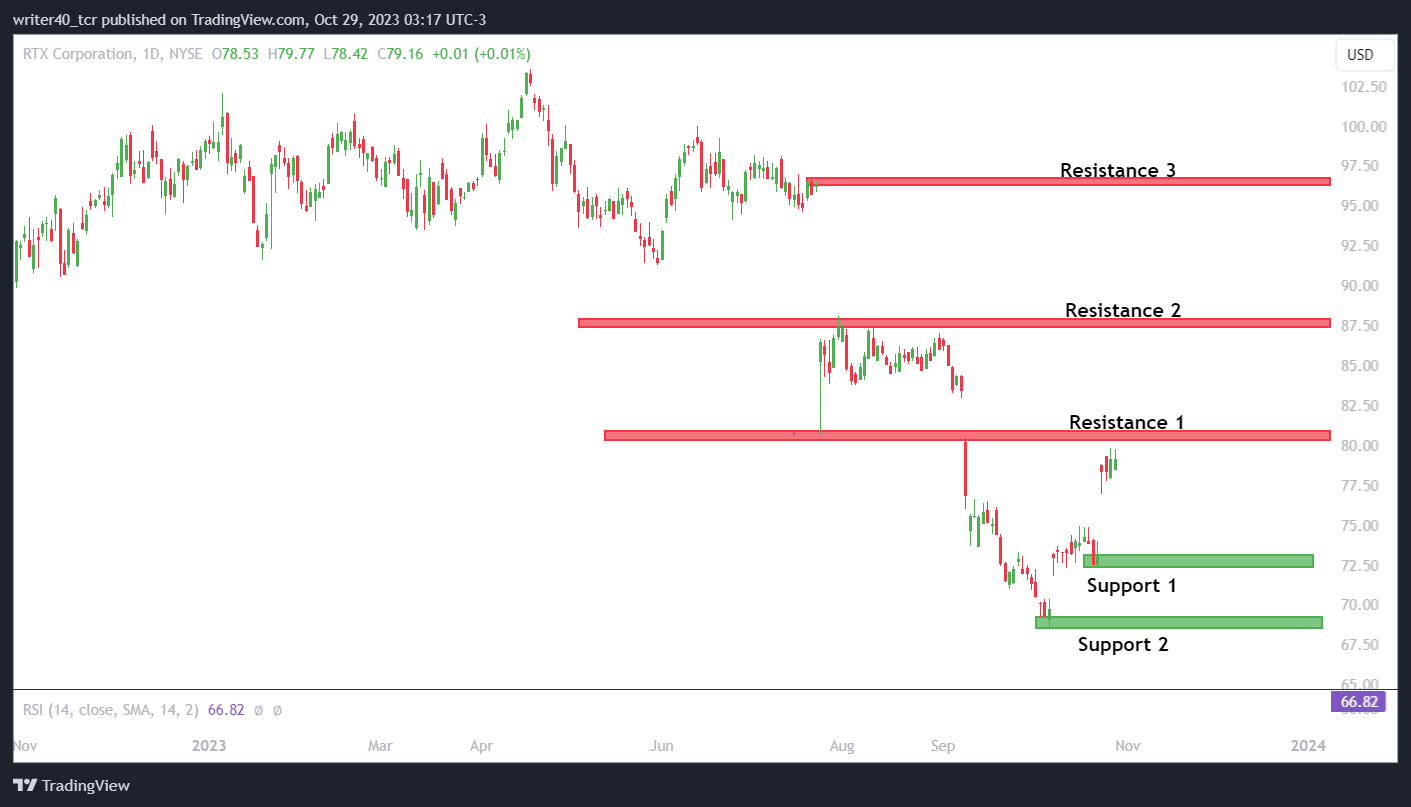
Those gaps can act as a support and resistance for the stock price as there is a big gap in between. Apart from this, the gap area of $80.31, $86.92, and $96.35 can act as a resistance level for the stock. $72.51 and $69.14 can act as a support level for the stock.
An Overview of the Exponential Moving Average and Relative Strength Index
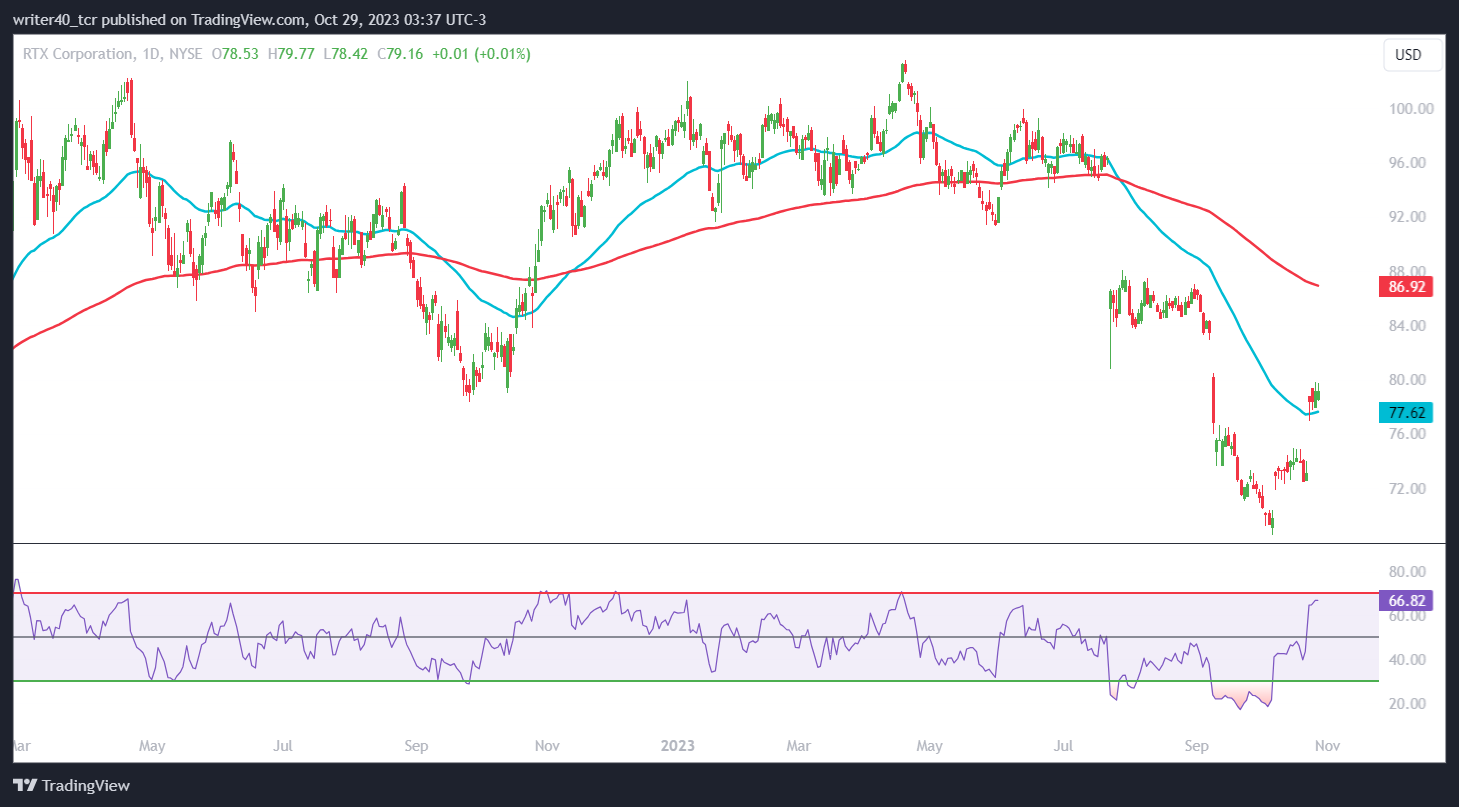
If we notice the RTX stock price, it is trying to sustain above the 50-day Exponential Moving Average. It means that the bulls are trying to reverse the overall trend of the stock. However, the 200-day Exponential Moving Average is still above the current market price. The Relative Strength Index is currently placed at 66.82, which shows that the odds are favoring bulls and they are ready to challenge the bears.
Conclusion
The recent development in the price action of the RTX stock, along with the positive financial report has boosted the stock price. The bulls are looking strong on the chart, as it seems like they are currently dominating the stock price. Bulls will try to capture the $80.31 level that can open the way towards $86.92.
Technical Level
Resistance – $80.31 and $86.92
Support – $$72.51 and $69.14
Disclaimer
The views and opinions stated by the author, or any people named in this article, are for informational purposes only. They do not establish financial, investment, or other advice. Investing in or trading crypto assets comes with a risk of financial loss.




