
 Quantus
 Injective
 NEAR Protocol
 Sei
Sei Derive
 Bitcoin
 Zcash
Zcash
- Truist Financial Corp Q3-2023 report beats the estimates.
- TFC stock trading at $28.02 with a loss of 1.65% during the intraday session.
- The year-to-date and three-month returns of TFC stock are -34.34 and -12.57%, respectively.
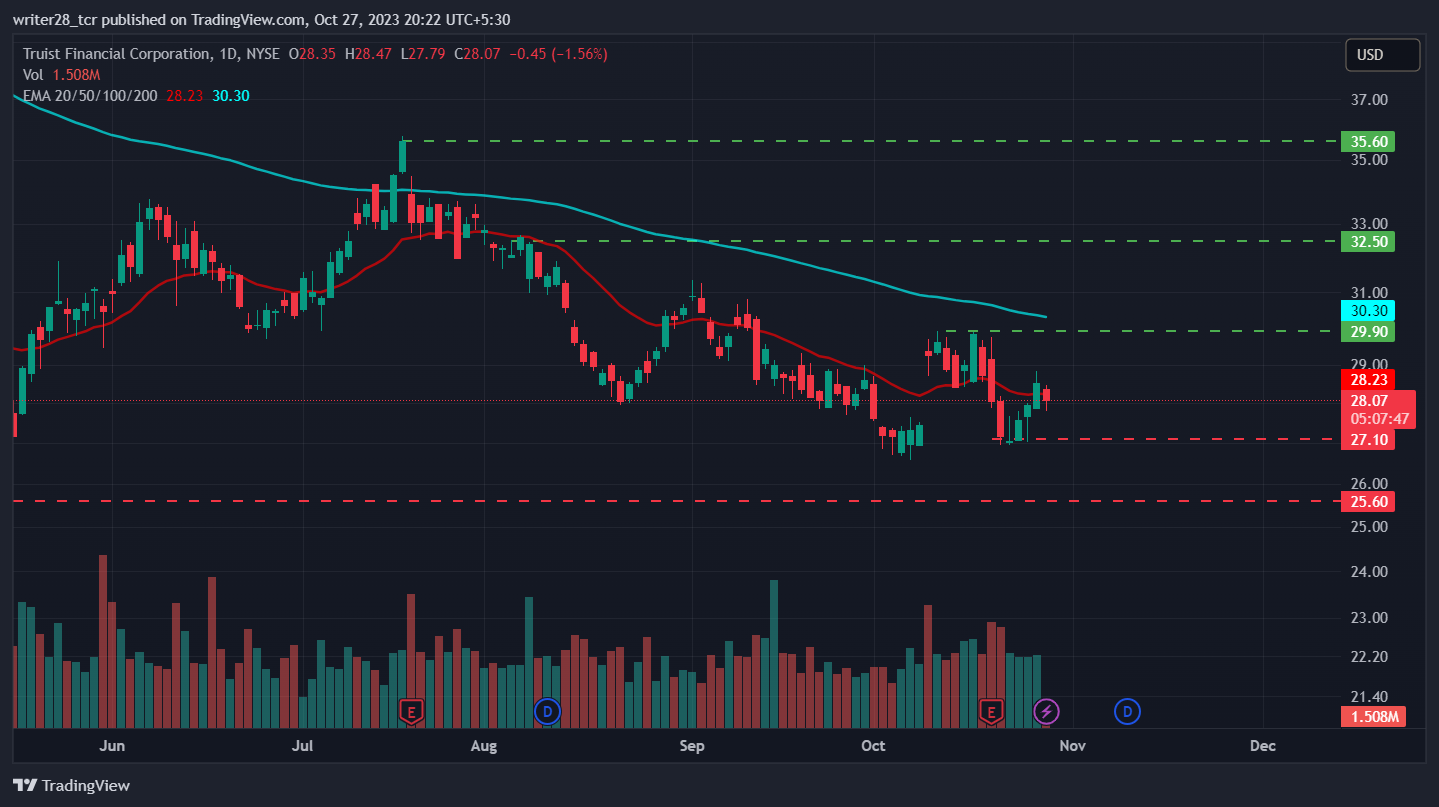
The Truist Financial Corp (TFC) stock price is trading at 28.02 while witnessing a decrease of 1.63% during the intraday session. The price is currently contesting for the 20-day EMA, indicating slight strength in the market. The market capitalization of Truist Financial is $37.02 Billion, with an average trading volume of 11.75 Million.
At the start of May 2023, the TFC stock price began its uptrend from its initial low of $25.56 support level. During the uptrend, the price consistently attained a higher high while securing the $35.78 resistance level on July 19. However, the investors gained approximately 39% during that period.
The TFC stock price faced rejection after securing the $35.78 high, which plummeted the price by about 25%. Hence, TFC stock price slid towards the $27.95 support level. It regained the bullish trend and bouched up at the $31.35 resistance level.
However, the bearish sentiment was so strong that it shattered the bullish move and dropped again, but this time, the price fell beneath the previous $35.78 support level. The downtrend pushed the price to a $26.57 support level.
Before the announcement of the third quarter report, the Truist Financial Corp stock price was hovering near the 29.90 mark. On Oct 19, 2023, the company released its Q3-2023 report, which aided the further meltdown despite the pregametic revenue result.
Q3-2023 Report Of Truist Financial Corp.
The firm reported data showing that the Q3 revenue results of $5.729 Billion beat the estimated revenue of $5.704 Billion by a surprise of 0.44%. Meanwhile, the earnings leaked the potential and failed to meet the estimated EPS of $0.815. At the same time, the reported EPS was $0.80, with a negative surprise of 1.83%.
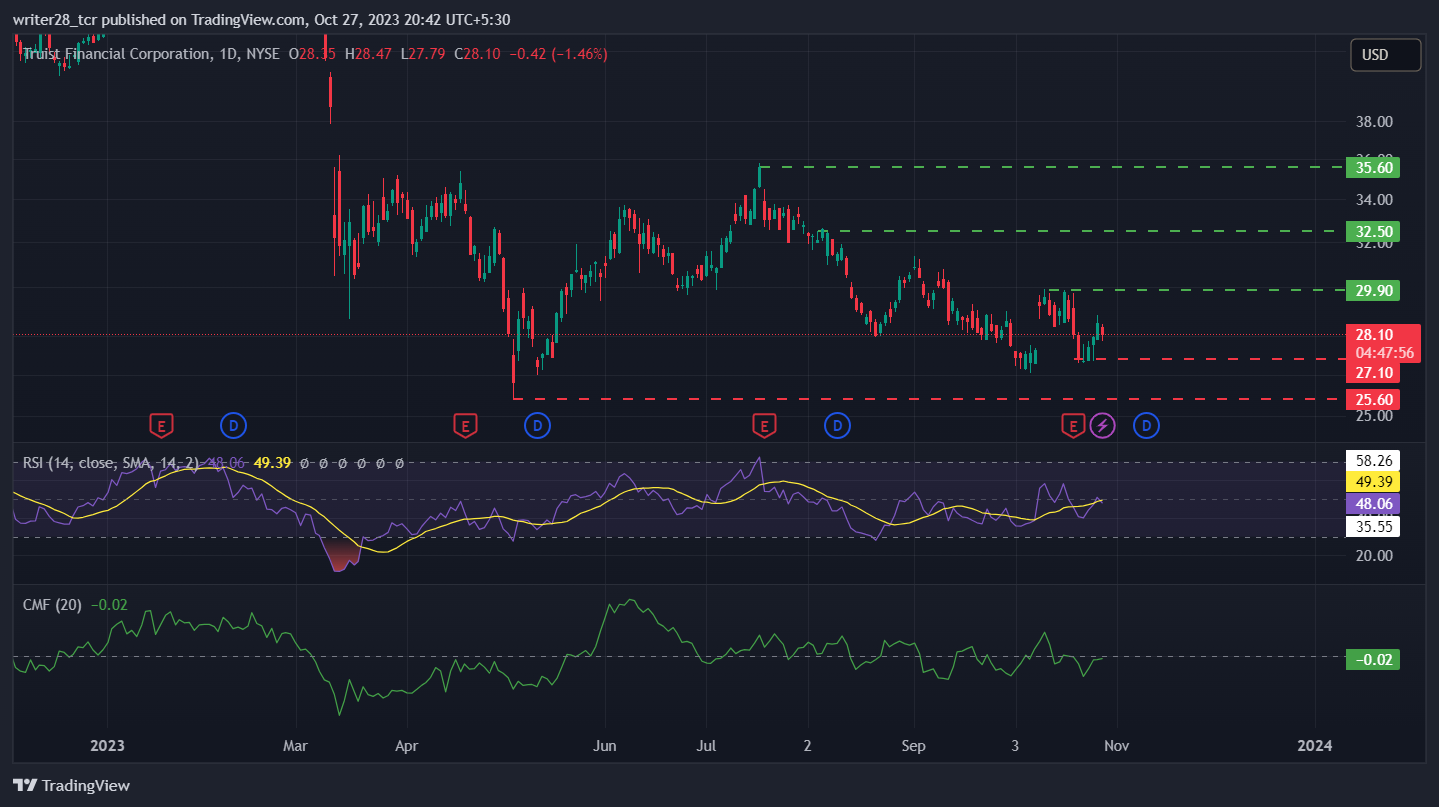
The Truist Financial Corp (TFC) stock price is currently contesting for the 20-day EMA. If a bullish trend prevails, then the price might conquer the 20-day EMA and may retest the 50-day EMA. Despite the prolonged downtrend, the price was capable of securing the 50-neutral zone of RSI. It suggests bears are facing challenge from the bullish side.
The Chaikin Money Flow (CMF) stands at -0.02, indicating slight weakness in the market during the intraday session. If the bearish stronghold sustains, the price might melt towards the annual low of 25.56 support level.
Conclusion
The market structure and price action of Truist Financial Corp stock are still indecisive according to the current scenario. However, the company has a more excellent plan to fix its recent losses and to attract more buyers. The TFC stock price has to surge continuously despite all odds.
The investors look for buying opportunities for the long-term psychology, as the price provides cheap options to invest. Meanwhile, short-term or intraday traders should look for selling opportunities as the technical parameters suggest the same.
Technical Levels
Major resistance: $35.78 and $51.26
Major support: $26.57 and $25.56
Disclaimer
The views and opinions stated by the author, or any people named in this article, are for informational purposes only. They do not establish financial, investment, or other advice. Investing in or trading crypto assets comes with a risk of financial loss.




