
 streamoors
 Celestia
 Injective
 Pudgy Penguins
 Pearl
Pearl NEAR Protocol
 Quantus
- BGB coin price is moving within an ascending triangle.
- The price is trading above the 50-day EMA and the 200-day EMA.
Launched in July 2021, Bitget Token (BGB) is a native utility token of the Bitget. It is a crypto-centralized exchange (CEX). This exchange aims to provide users with a form of payment for staking, social trading, receiving discounts, profit-sharing, etc. The platform provides low transaction costs as it uses the decentralized blockchain network and has become the third-largest derivatives exchange in the world.
Previous Actions of the BGB Token
The BGB coin price surged more than 117% after the breakout of the $0.2377 resistance level. It created a new all-time high resistance of $0.5174, which became the upper range of a huge ascending triangle pattern.
On April 10, 2023, the BGB price made another resistance at $0.4774. It increased the possibility of a rising wedge or ascending triangle pattern. Subsequently, the price dropped to the $0.3253 support level and that became the second pullback level.
The buyers tried to break above the all-time high resistance but failed because of the lower trading volume. Consequently, the BGB price fell more than 20% to the trendline forming below on October 19, 2023.
At present, the BGB token has a total circulating supply of 1,400,000,000 BGB coins, which currently have a value of $684,658,634.
Technical Analysis of the BGB Coin
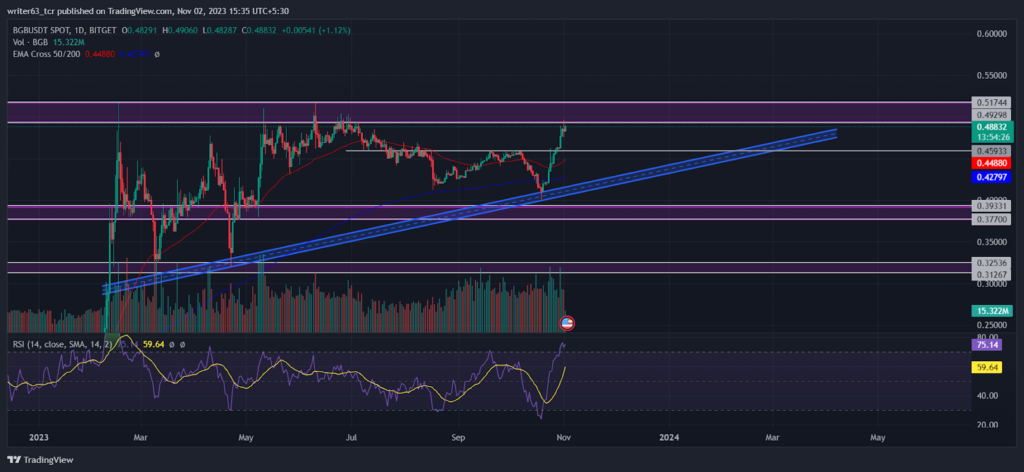
The BGB coin price is moving above the 50-day EMA and the 200-day EMA, displaying an uptrend. In a closer look, the price gained strong bullish impulsion after it touched the 200-day EMA. At present, both the EMAs are at the level of $0.4488 and $0.4279 respectively.
The BGB coin price is currently trading within an ascending triangle pattern. Recently, it took support from the trendline forming below above the $0.3933 support level. Subsequently, the price broke above the $0.4593 immediate resistance level. It is now facing resistance from the $0.4929 level. It may probably make a pullback to the $0.4593 level and then it will go for the $0.5174 resistance.
According to the relative strength index (RSI), the BGB price is moving in a strong bullish momentum. That reflects the dominance of bulls over the current coin price. The RSI is sloping at 75.13, above the 70-mark upper band.
Conclusion
Overall, the BGB coin price is currently moving in an uptrend. Its price is still in the formation of the ascending triangle. Recently, it took support from the 200-day EMA or the trendline forming below. It is now facing resistance from the $0.4929 level. Probably, the BGB coin price may make a pullback to the $0.4593 immediate support level subsequently, it will go for an all-time high resistance level of $0.5174.
Technical Levels
- Resistance levels: $0.5174 and $0.6669
- Support levels: $0.4593 and $0.3770
Disclaimer
The views and opinions stated by the author, or any people named in this article, are for informational purposes only. They do not establish financial, investment, or any other advice. Investing in or trading crypto assets comes with the risk of financial loss.



