
 streamoors
 IGNITION
 Sui
Sui Quantus
 Bitcoin
 Pearl
Pearl Solana
- Universal Insurance Holdings Inc. stock is performing well and has shown a huge return last year.
- Universal Insurance Holdings, Inc. stock is recommended as a strong buy by the technical summary.
- UVE stock is expected to grow by over 29.7% in the upcoming year.
Universal Insurance Holdings, Inc. is a company focused on providing property and casualty insurance along with valuable insurance services. It specializes in creating, promoting, and managing insurance offerings for individuals.
Trend Analysis of UVE Stock
The analysis provided by TradingView indicates a target price of $21 for UVE stock in the upcoming year, reflecting a substantial 29.7% growth compared to the current price.
UVE stock boasts a low beta of 0.8, signifying low volatility and reduced risk, making it an attractive option for investment.
The company has a dividend payout ratio of 27.3% and offers a 3.9% dividend yield, which is a favourable aspect for investors seeking regular income from their investments.
Universal Insurance Holdings has outperformed its earnings, with Q3 2023 earnings surpassing expected earnings by approximately 45%, underscoring the company’s robust financial performance.
Recent stock performance is impressive, with a 14% rise in the past week and nearly 60% growth last month, indicating strong company performance and an overall positive pattern.
Previously, the stock price was confined within a triangle pattern, but it recently broke out from this pattern. The stock is currently on an upward trajectory, and the overall structure appears favourable, suggesting a potential price rise in the upcoming days.
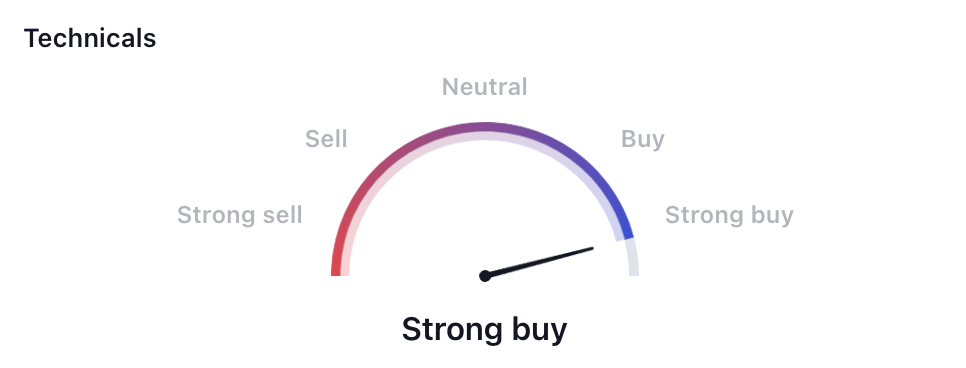
Furthermore, the TradingView technical indicator summary strongly recommends buying UVE stock, and the moving averages summary supports this buy signal. These factors are likely to draw the attention of buyers and contribute to a potential price increase.
Universal Insurance Holdings Inc. (UVE) Stock Price Analysis
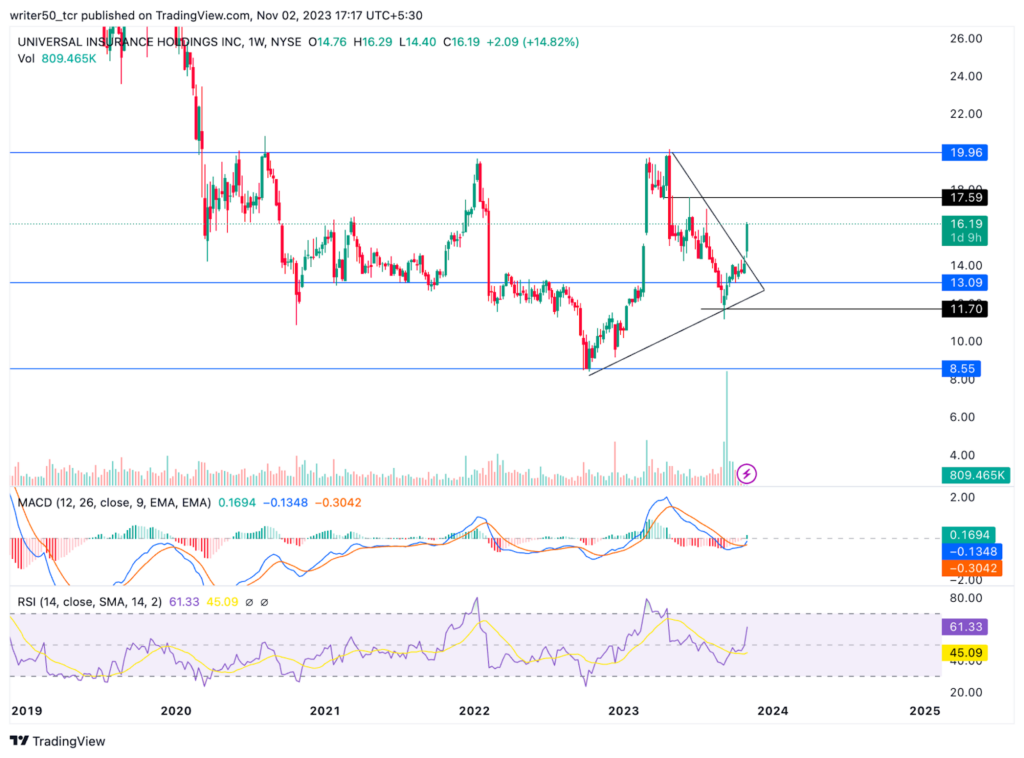
When examining the technical indicators for Universal Insurance Holdings Inc., it can be observed that both the MACD line and the signal line are positioned above the zero line. Moreover, the MACD indicator features a green histogram, symbolizing strong momentum. These signs can be interpreted as potential indicators of a positive market sentiment.
In the case of UVE stock, the RSI line is positioned higher than the signal line, and both lines reside in the positive territory. This configuration implies the potential for a price increase in the upcoming days.
NYSE : UVE Stock Chart by TradingView
Conclusion
As per the analysis, the UVE stock has recently given a breakout from the triangle pattern, which is a positive signal. The indicators are also positive for the stock and overall fundamental factors favour the price rise in the upcoming days. Hence, this increases the probability of a price rise.
Technical Levels
- Support Levels – $13 and $11.70
- Resistance Levels – $17.59 and $19.96
Disclaimer
The views and opinions of the author, or anyone named in this article, are for informational purposes only. They do not offer financial, investment, or other advice. Investing or trading crypto assets involves the risk of financial loss.



