
 streamoors
 IGNITION
 NEAR Protocol
 Injective
 LayerZero
 Pearl
Pearl Hyperliquid
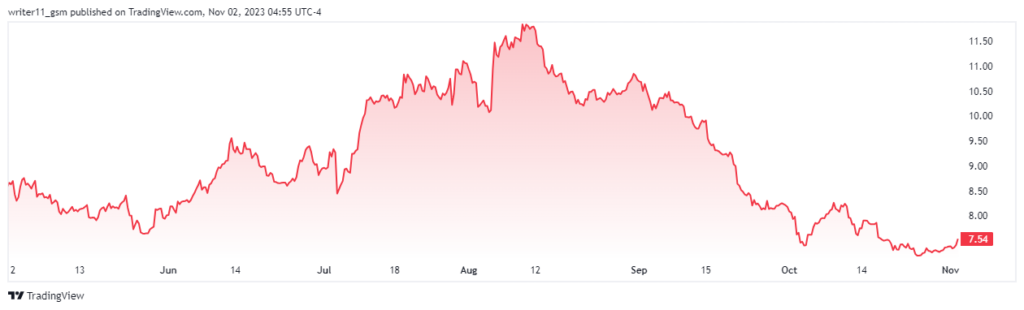
- Rocket Companies Inc. has witnessed a decline of 15% in its stock price in the last six months.
- RKT stock is considerably more volatile than the average of the market.
The Rocket Companies Inc., formerly known as Quicken Loans LLC, is an American mortgage lender. The current CEO of the company is Varun Krishna and has more than 24K employees. It was founded in the year 1985 and has its headquarters in Detroit.
The RKT stock is trading with a beta of 2.74 and has 112.494M shares floating in the market. Out of the total floating shares, 12.37% of the shares are held closely by the investors resulting in 15.878M.
The Rocket Companies Inc.’s revenue comes from the United States and Canada. The RKT stock is following a 52-week range of $6.11-$11.95. Also, the reported gross margin of the company is 96.75% and the EPS of the stock is -$0.21.
Rocket Companies Inc. Stock Performance Analysis
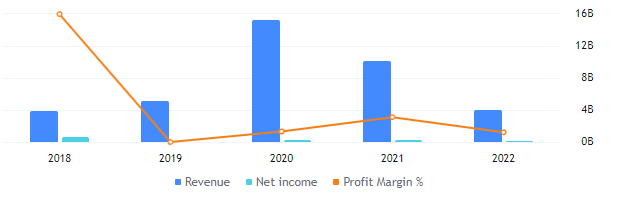
The revenue for the company has been declining for the last two reported years. Rocket Companies Inc. has reported a profit margin of 1.21% resulting in a net income of $46.44M. It also reported a debt of $10.35B in the year ending 2022 following a free cash flow of $10.73B.
Advance Witnessed In Last Trading Session, Will RKT Stock Reverse?
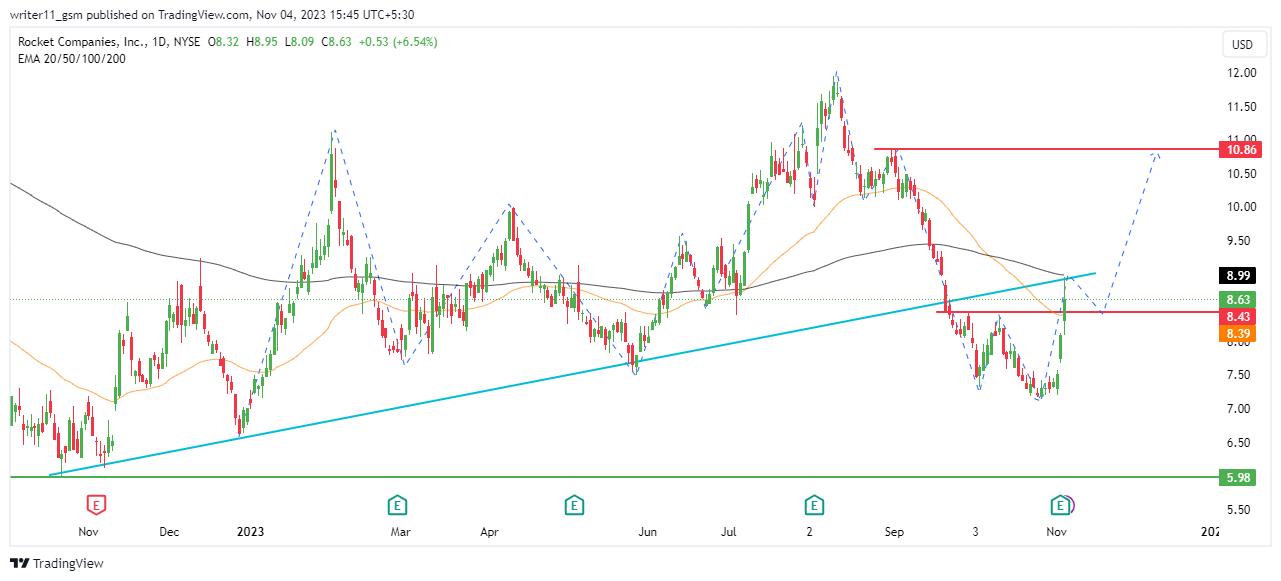
The RKT stock price has been consistently declining for a long time and has lost its value by more than 50% from its IPO price. This is a sign of a strong downtrend and the price might continue to decline to further lows.
Following the most recent price action on the RKT stock chart, the share price of the stock has advanced in the last trading session. The most recent swing high of the stock is $8.50. If the stock price breaks above the following level then it might lead to new highs.
The 50-day and the 200-day EMA currently has formed a death cross on the charts. Following this, the stock price of Rocket Companies Inc. is consistently declining.
The RSI is trying to reverse from the oversold zone on the RKT stock chart. It has also crossed above the 14-day SMA line. If this momentum continues and the RSI breaks above the 50 level, the share price might continue to advance to higher levels.
RKT/NYSE Stock Chart by Tradingview
Conclusion
Due to a decline in the revenue and profit margin, Rocket Companies Inc. looks weak financially. The RKT stock is also following a strong bearish trend on the charts. Therefore, if the stock price breaks above the level of $8.50 then it might lead to higher levels.
Technical Levels
- Support levels- $4.00 and $6.00
- Resistance levels- $8.50 and $10.80
Disclaimer
The information provided in this article, including the views and opinions expressed by the author or any individuals mentioned, is intended for informational purposes only. It is important to note that the article does not provide financial or investment advice. Investing or trading in cryptocurrency assets carries inherent risks and can result in financial loss.



