
 Quack AI
 NEAR Protocol
 Pudgy Penguins
 Pearl
Pearl Quant
Quant Quantus
 Sui
Sui
- The NEO coin price has surged by over 33% in a week and 41% in a month.
- The price has given a breakout of the descending triangle pattern on the daily chart.
- The current market price of the NEO coin is $10.11.
After being listed on the Binance Exchange, the NEO coin price has shown a great surge of over 500% from the lower level. Soon, the coin price witnessed a massive decline and it fell to the level of $3.89. In March 2020, the coin price interrupted the fall and created a swing high of $141 in May 2021.
The NEO coin price has been in a downtrend since May 2021 as the price has fallen down from the $141 level. It formed a lower high and lower low chart formation on the daily chart, which confirms the downtrend of the coin. This downfall lasted till December 2022.
In 2023, the NEO coin price started the initial phase of the year with a bang as the stock price surged impressively with a rise of over 164%. The bulls held the price at the upper levels for about two months, before the bears entered. Subsequently, the bears showed complete dominance and brought the price down.
Synopsis of the NEO Coin Chart
The NEO coin price has recently breached the descending triangle pattern and ended the consolidation phase of the coin. The price has taken support from the lower level of the pattern twice and formed a double bottom pattern on the chart. The price has participated in the ongoing rally of the market.
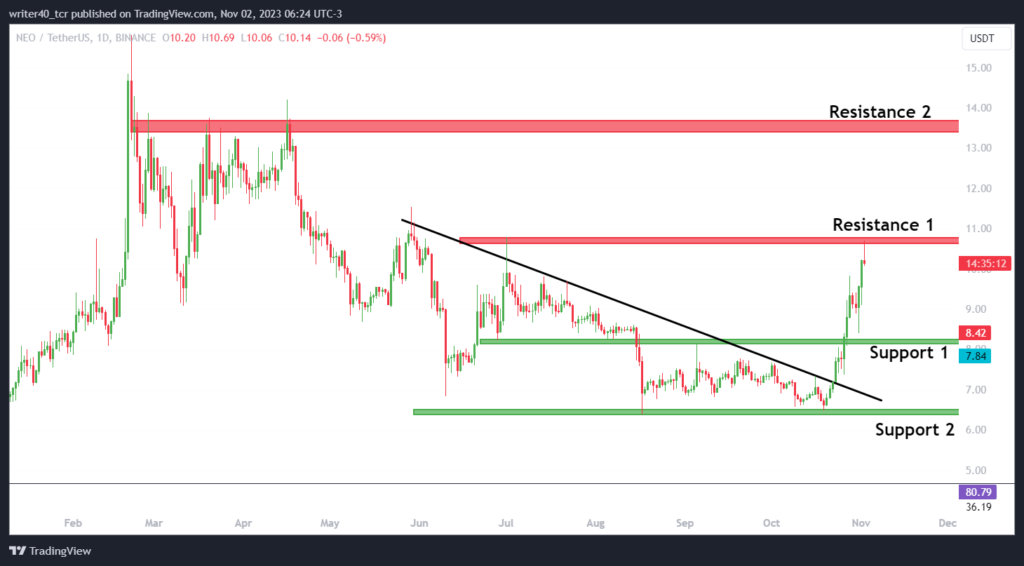
The NEO coin price has given a breakout of the pattern and shows a great surge of 64% in a short period. The price is facing a strong rejection from the previous swing high of $10.70. If the price breaks this level then it can move towards the level of $13.71. The most recent swing low price, which has emerged during this uptrend, is situated around the $8.25 level, and it is expected to act as a support for the price.
An Outlook of the Indicators Used in the Technical Analysis
The NEO coin price is situated above the 50-day and 200-day exponential moving averages (EMAs). It has regained both the EMAs recently in the rally and the price has successfully tested the 200-day EMA. The slope of the 50-day EMA is rising which indicates that the bulls are gaining momentum.
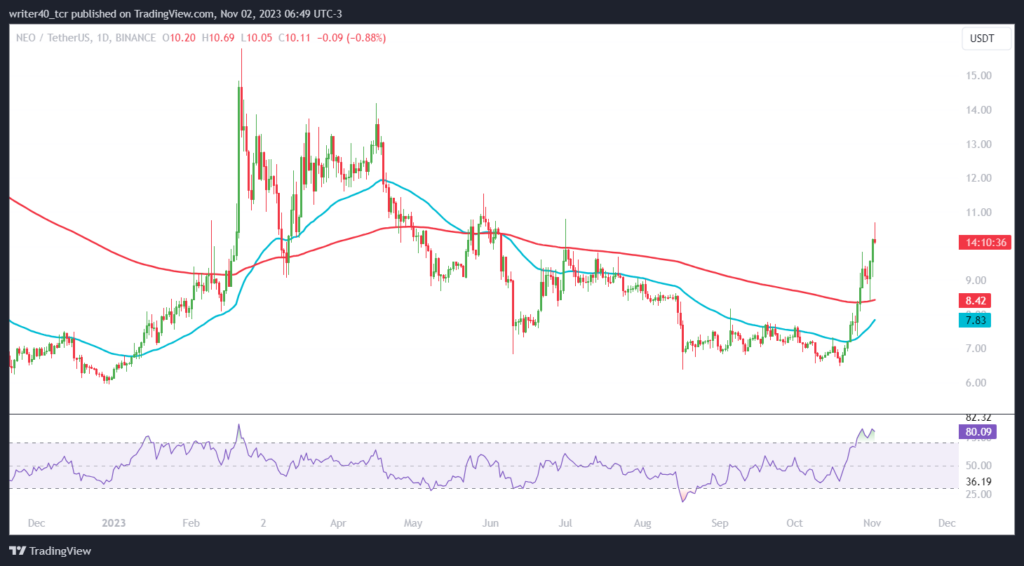
Despite the relative strength index (RSI) curving at 80.79, which typically suggests an overbought condition, the coin’s price is continuing to rise without paying heed to the RSI indication. This behavior may be indicative of strong bullish momentum in the market.
Conclusion
The current surge in the coin is caused by a rally in the whole crypto market. So, the future rally of the coin depends on the future momentum of the crypto market as a whole. If the crypto market remains bullish ahead, the price of the coin will also rise.
Technical level
Resistance – $10.70 and $13.71
Support – $8.25 and $6.40
Disclaimer
The views and opinions stated by the author, or any people named in this article, are for informational purposes only. They do not establish financial, investment, or other advice. Investing in or trading crypto assets comes with a risk of financial loss.




