
 Dacity Coin
 Celestia
 Quantus
 Bitcoin
 Pearl
Pearl Pons
Pons Injective
- The SNX coin price has formed a symmetrical triangle pattern on the daily chart.
- The price escalated by over 71% in 2023.
- The current market price of the Synthetix coin is $2.473.
In the current trading session, the Synthetix coin price has risen by 4.61% or $0.109. The current trading session volume of the coin is 3.77 Million and the market capitalization is $675 Million. 273,485,395 SNX tokens are currently in supply out of a total of 326,565.879.
The Synthetix coin price is in a strong downtrend in 2023. However, the SNX coin price has shown a sharp jump at the beginning of the year. Both bulls and bears dominated the coin price at one time. The coin price has faced rejection from the upper level twice. This indicates that the sellers are aggressively present at that level.
The Synthetix coin price is currently witnessing great buying pressure from the lower levels. It seems like the sellers are helpless currently and they are not providing liquidity to the price. The price is not showing any signs of weakness and it seems like the sellers will find difficulty in halting the current uptrend.
A Quick Synopsis of the SNX Coin Chart
The SNX coin price has formed a symmetrical triangle pattern on the daily chart. It has taken strong support from the lower trendline of this pattern. The price has shown a sharp surge from the lower level. It is heading towards the upper trendline resistance, which is present at the level of $2.949.
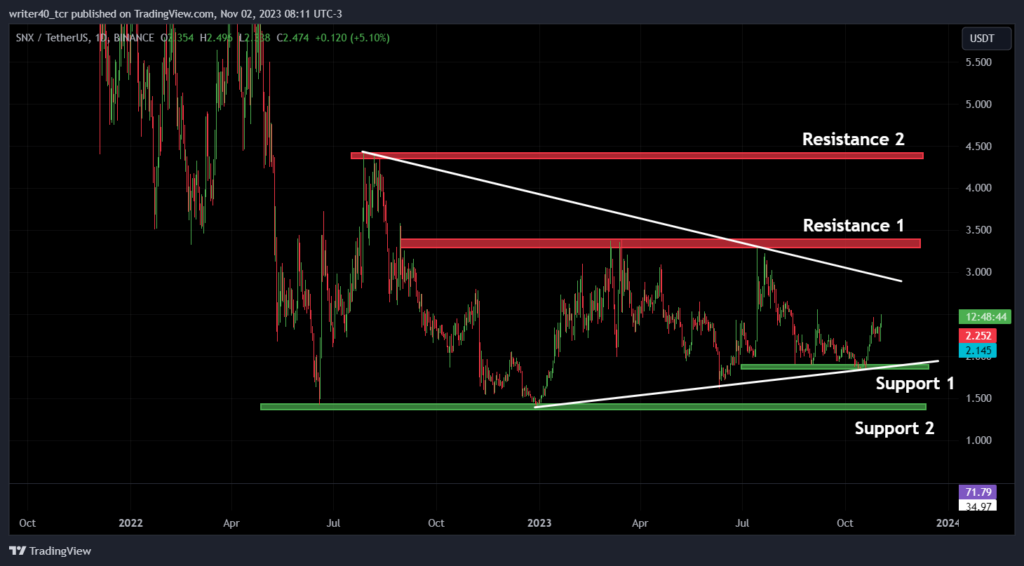
The SNX coin price has defended the level of $1.855 as the price has tested this level multiple times. It will play a crucial role in the future to provide the necessary support to the price. If we consider the resistance levels for the coin, they are present at $3.407 and $4.418.
An Outlook of the EMA and RSI Indicators
The SNX coin price is situated above both the 50-day and 200-day exponential moving average (EMA). This is an indication of the bullishness of the price. The slope of the 50-day EMA is curving up and it may soon make a golden crossover. However, the EMA has been flat since March 2023 and this is a sign of a sideways trend.
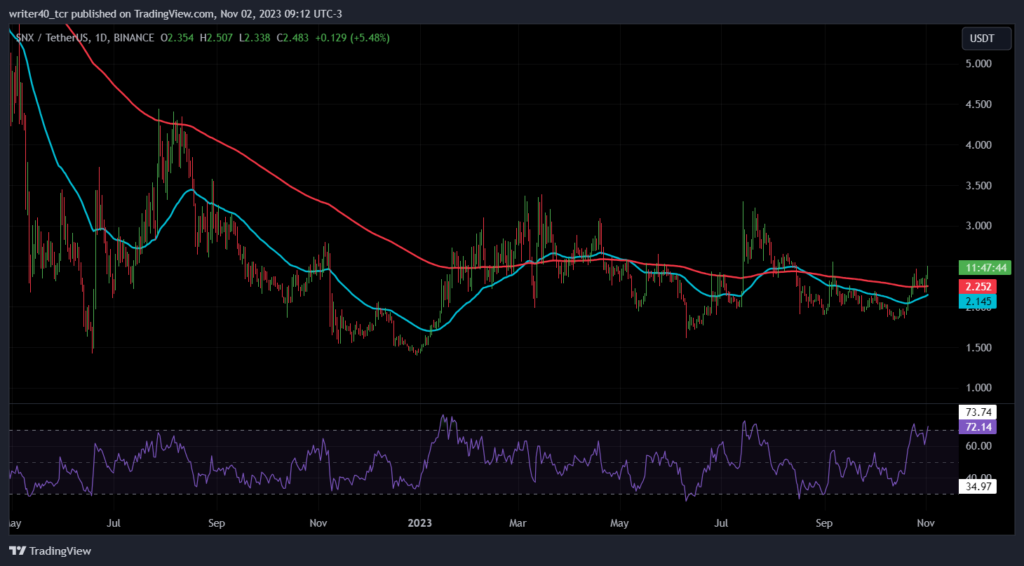
The relative strength index (RSI) is curving at 72.14, which shows that the price is overbought and needs some correction before it resumes the uptrend.
Conclusion
The SNX coin price has clearly underperformed as it has not participated much in the current crypto market rally. However, the price is currently surging and is showing strength in the favor of bulls. The price needs to break out of the symmetrical triangle pattern to show massive momentum on either side.
Technical Level
Resistance – $3.407 and $4.418.
Support – $1.855 and $1.375
Disclaimer
The views and opinions stated by the author, or any people named in this article, are for informational purposes only. They do not establish financial, investment, or other advice. Investing in or trading crypto assets comes with a risk of financial loss.




