
 NEAR Protocol
 Bitcoin
 Aerodrome Finance
 Pearl
Pearl Uniswap
 Quantus
 Pudgy Penguins
- IOTA crypto is trading at a price of $0.1726, with an increase of 2.89%.
- The derivative volume for the IOTA crypto has witnessed a huge increase.
The derivatives volume for the IOTA crypto has increased by 96.80% in the last 24 hours, resulting in $27.72 Million. Following this, the spot volume for the crypto has increased by 54.46%. This has resulted in a market cap of $518.458 Million, which has increased by 3.05% in the last 24 hours.
The circulating supply of the IOTA crypto is 2.999 Billion IOTA, which makes up 65.21% of the maximum supply. The fully diluted market cap of the crypto is $795.272 Million, resulting in a market cap dominance of 0.038%. As per Coingecko, the current market cap rank of the crypto is #87.
The current volume/market cap ratio of the crypto is 0.0287 and the long/short ratio of the crypto is 1.0101, with a huge long liquidation of $39.35K.
IOTA Crypto Technical Analysis
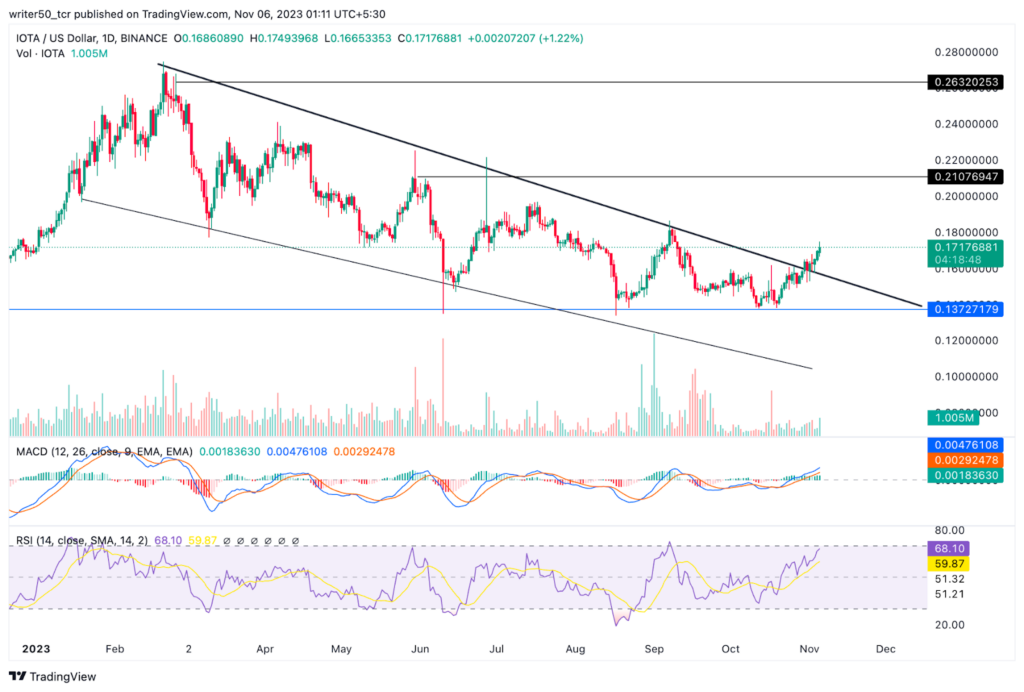
The IOTA crypto has been losing its value from the higher levels, leading to a consistent decline in price. This behavior led to the formation of the falling wedge pattern and the crypto recently broke out above this. This indicates that new buyers are entering the market and are trying to gain dominance.
The IOTA crypto price is forming a death cross pattern and is currently residing between the 50-day and the 200-day EMAs. The crypto is facing resistance from the 200-day EMA and if it breaks above this, It might continue to advance to higher levels.
The RSI is currently at a level of 68.56 followed by a 14-day SMA value of 59.90. This shows that the RSI is indicating a possibility of bullish momentum.
Conclusion
The IOTA cryptocurrency experienced a prolonged decline, forming a falling wedge pattern, which it recently broke out of, suggesting renewed buyer interest. Despite the formation of a death cross pattern, the price is positioned between the 50-day and 200-day EMAs. Breaking above the 200-day EMA could trigger further upward movement. The RSI and increased derivatives volume indicate potential bullish momentum, supporting the possibility of a price increase.
Technical Levels
· Support levels– $0.14260 and $0.08750
· Resistance levels– $0.21050 and $0.26860
Disclaimer
The views and opinions stated by the author or any other person named in this article, are for informational purposes only and do not constitute financial, investment, or other advice. Investing in or trading crypto or stocks comes with a risk of financial loss.




