
 Minter
 Bittensor
 Quack AI
 NEAR Protocol
 Pons
Pons Pearl
Pearl Bitcoin
- The DIS stock price is currently trading at $85.07.
- The price has formed a bullish pattern in the daily timeframe.
- It has given the breakout of the descending trendline.
The Walt Disney (NYSE: DIS) is a is a mass media and entertainment conglomerate. It owns and operates theme parks, a Television channel, and products related to Disney themes.
The Walt Disney (DIS) Daily Chart Analysis
Ever since the DIS company created its all-time high of $203.02, it started its fall in price with a strong resistance of descending trendline. Since then, the company stock has fallen by 60.89%.
The DIS stock price fell and halted at the 2020 low. After which it went inside the consolidating phase in a range of $78.74 to $86.28.
The DIS stock has gained 7.31% from its recent swing low. It has formed a triple bottom pattern, which is a bullish pattern, in the consolidation range.
The descending trendline which was restricting the further rise in price has also been broken. It denotes the buyers are trying to do a trend reversal from this point and expecting the DIS stock price to outperform in the upcoming months.
The DIS stock is currently trading at $85.07 just below the resistance of $86.28. It registered a gain of 2.14% in the last intraday session where it traded with a trading volume of 11.332 Million.
Will a Follow Momentum Come in DIS Stock?
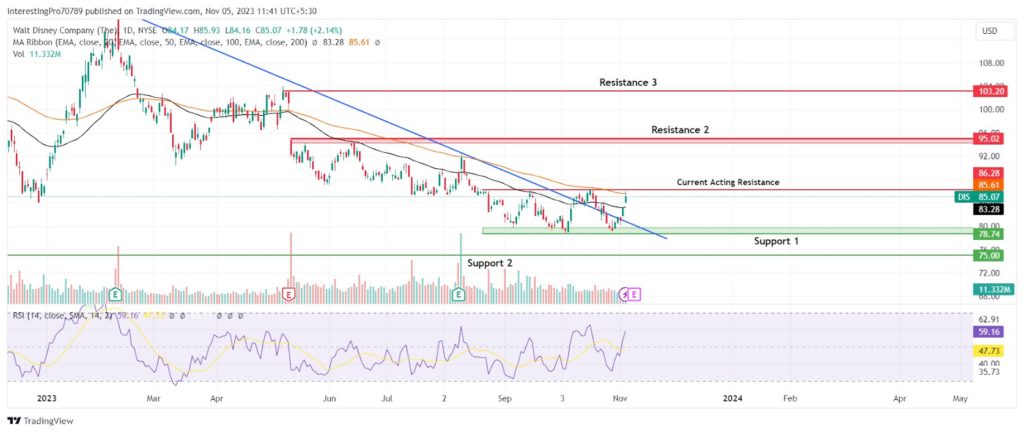
The DIS stock price in the recent trading session, reclaimed the 50-day EMA which shows the buyers are slowly trying to take control of the price. Currently, it is testing the 100-day EMA where sellers are trying to hold the price below the EMA line.
However, the increase in buying volume may favor the buyers to close the price above the 100-day EMA in the upcoming trading sessions.
The relative strength index is at 59.16 which is almost marked in bullish territory. The RSI line is trending in the upward direction showing the ongoing pressure. The space left in the upward might invite more buyers to continue the buying pressure in the upcoming trading days.
The RSI is showing that the buying pressure might continue in the upcoming trading session. The breakout of the 100-day will trigger the bullish momentum and a follow-up will surely come in favor of buyers.
DIS Price Formed a Bullish Engulfing Candle
The DIS formed a bullish engulfing candle in the weekly timeframe with a strong buying volume. The bullish engulfing candle has also given the breakout of the descending trendline. It denotes the buyers may take full control of the price in the upcoming months and make the price rise in the future.
The DIS stock price needs to close above the $86.28 hurdle which will trigger the next phase of a bullish rally and the price may reach its next resistance at $95.02. If it also gives the breakout of this level then the price might reach to its next resistance at $103.20.
The $78.74 holding the price above is a crucial level for buyers. The closing of the price below this level may trigger the continuation of the overall bearish trend. After which the price fell to its next support at $75.00.
Conclusion
The DIS future price prediction is bullish as it is showing signs of a trend reversal. However, the $86.28 resistance level may give some trouble for a further rise in price. The breakout of this level will signal the trend reversal and buyers will have full control of the price. Thus, Investors should wait for the breakout of this level which may trigger a bullish rally.
Technical levels
Resistance Levels: $86.28, $95.02, and $103.20
Support Levels: $78.74 and $75.00
Disclaimer
The views and opinions stated by the author or any other person named in this article are for informational purposes only. They do not provide financial, investment, or other advice. Investing or trading in crypto comes with a risk of financial loss.




