
 Pearl
Pearl Ondo
Ondo Starknet
 Quantus
 Aerodrome Finance
 Pudgy Penguins
 Akash Network
- General Motors’ stock is recommended as the sell signal by the technical indicator summary tool.
- General Motors’ stock price has given a return of over 32% in the previous year.
- General Motors’ indicators are also showing a bearish signal.
General Motors Company is involved in the creation, production, and sale of trucks, crossovers, cars, and automotive components, along with delivering software-enabled services and subscriptions.
Trend Analysis of GM Stock
General Motors Company is showing a downtrend momentum in the weekly timeframe. The price is forming a lower low pattern followed by the breakdown from the channel pattern.
The technical indicator summary by TradingView gives a “sell” signal to the GM stock. Out of the 26 top indicators, 14 give a sell signal and only 3 are bullish. The moving averages summary also recommends a strong “sell” for the stock in the upcoming days.
The price of the stock gave a return of over -32% in the previous year. This negative return by the stock brings down the reputation of the company. Also, the gross profit for Q3 2023 for General Motors is $5.3 Billion and it has declined by -8.7% YoY.
The price of the stock hit a high of $67.2 in January 2022 and after this, the price fell by nearly 60% till today. The was moving in the channel pattern for more than one year and recently the price has given a breakdown from the channel. The overall pattern of the stock is negative and the price is showing a weak momentum. The price is expected to decline in the upcoming days.
General Motors (GM) Stock Price Analysis
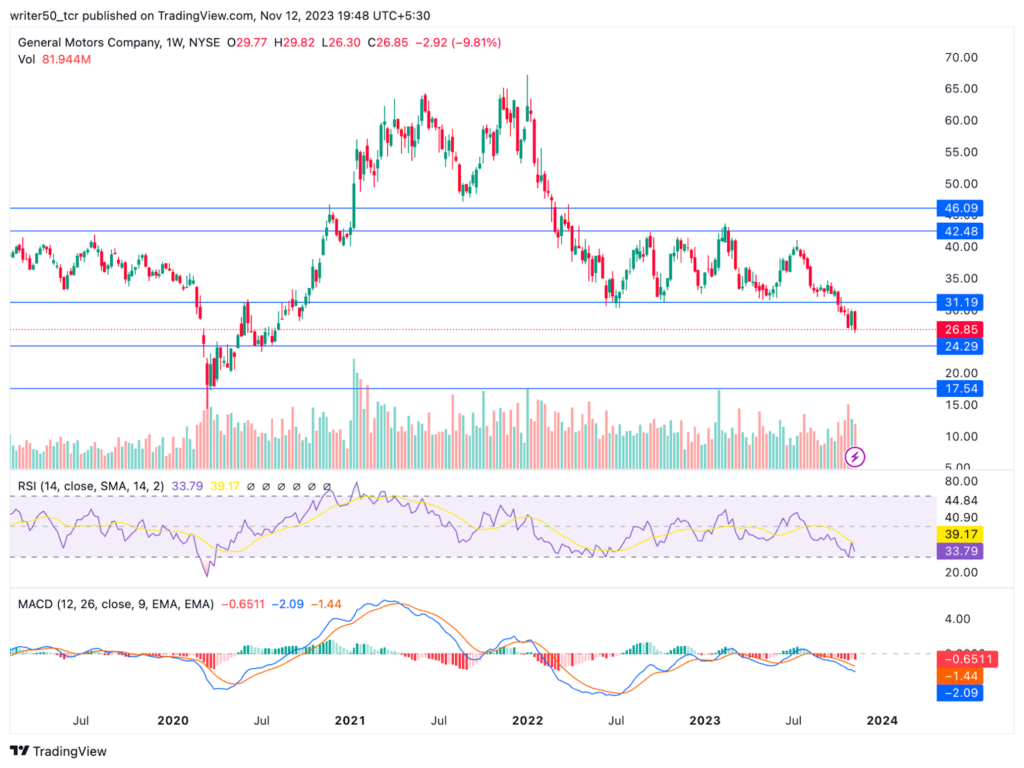
The ongoing decline in General Motors’ trading volume indicates diminished market activity and a potential waning interest from buyers. This reduction in volume may contribute to a decrease in the stock’s value.
Furthermore, supporting the prevailing downtrend is the MACD indicator, which is positioned below the signal line, accompanied by the formation of a red histogram. These indicators are considered weak signals, suggesting a possible downtrend in the stock price in the days ahead.
The RSI line for the GM stock is currently at 3 and the SMA line is at 39. Both the lines are in the negative zone and the SMA line is above the signal line. Hence, the price is expected to decline in the future.
Conclusion
As per the analysis, the GM stock is moving downwards and the price has recently given a breakdown from the channel pattern. The overall pattern of the stock is negative and the price has given a negative return in the previous year. Hence, the price is expected to decline in the upcoming days.
Technical Levels
- Support Levels – $24.98 and $17.5
- Resistance Levels – $31.19 and $42.48
Disclaimer
The views and opinions of the author, or anyone named in this article, are for informational purposes only. They do not offer financial, investment, or other advice. Investing or trading crypto assets involves the risk of financial loss.




