
 Pearl
Pearl Bitcoin
 NEAR Protocol
 Starknet
 Solana
 Quant
Quant Ondo
Ondo
- Mastercard Incorporated stock has a target price of $444.39 for the upcoming year.
- MA stock has given a return of more than 16% last year.
- The MA stock has a beta of 1.18 which is considered safe to invest in.
Mastercard Inc. operates as a technology company within the payments industry, facilitating connections among consumers, financial institutions, merchants, governments, and businesses. The company provides payment solutions for the creation and execution of credit, debit, prepaid, commercial, and payment programs.
Technical Analysis of MA Stock
The MA stock is demonstrating an upward trend in the daily timeframe, exhibiting a reversal after reaching the support level.
The projected target price for MA stock in the coming year is $444.39, indicating a 12.69% increase from the current value. This optimistic projection suggests anticipation of favorable returns. As per the technical indicator summary on TradingView, the stock receives a buy signal. Among the 26 indicators, 14 recommend a buy, while only a few suggest a sell signal. This points towards a potential uptrend soon. With a beta of 1.18, MA stock is considered less volatile and relatively safe for investment.
After reaching a peak of $418.60 in September 2023, the price experienced a decline of nearly 14%, finding support at $362. The Mastercard Inc. stock has reversed its course after hitting this support level and is on an upward trajectory. The overall structure of the stock is forming a positive pattern, increasing the likelihood of a price rise in the upcoming days.
Additionally, the net income of MA stock has shown consistent growth, averaging 14% per quarter. The net profit has increased over the past three quarters from $2.36 Billion to $3.19 Billion.
Mastercard Inc. (MA) Stock Price Analysis
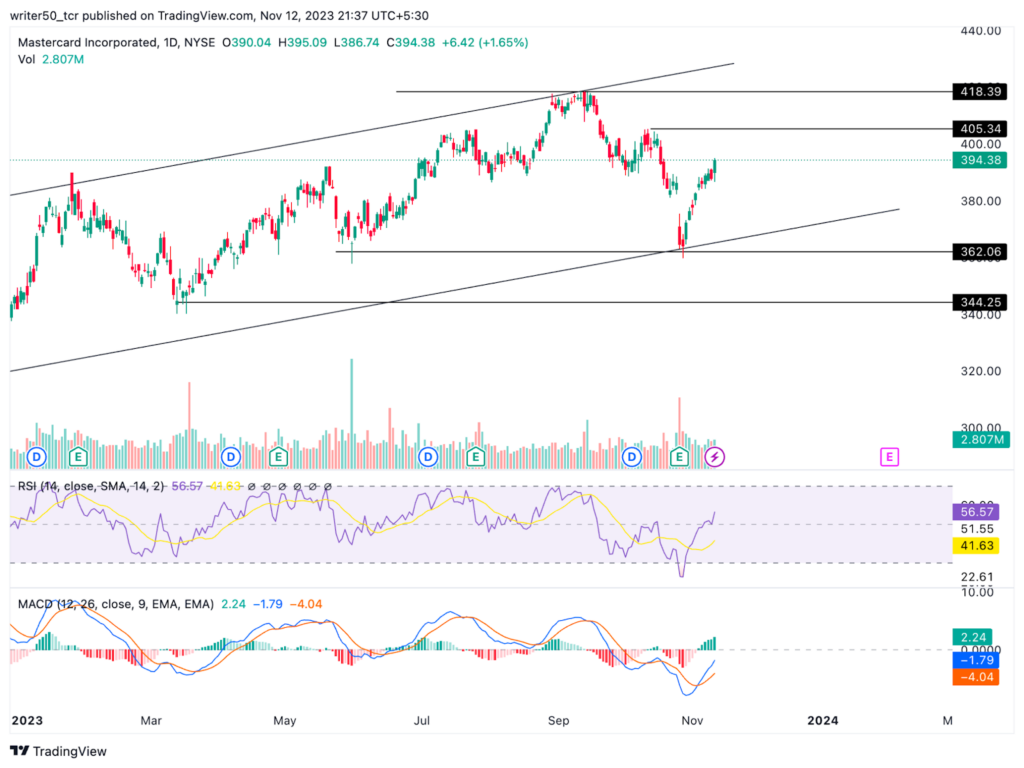
The MACD line of MA stock is positioned above the signal line, accompanied by the formation of a green histogram. This configuration is interpreted as a positive signal, suggesting a potential price rise in the upcoming days.
The RSI line for MA stock is situated at 56, with the SMA line near 41. The RSI line holds an advantage over the SMA line, having undergone a positive crossover. As a result, there is an expectation of a rise in the stock price in the coming days.
Conclusion
As per the analysis, MA stock is currently following an upward trend. The price has exhibited a reversal after hitting a support level and is currently ascending. Favorable indicators and a general enhancement in net profit suggest the likelihood of an increase in the stock price in the upcoming days.
Technical Levels
- Support Levels: $362 and $344
- Resistance Levels: $405 and $418
Disclaimer
The views and opinions of the author or anyone in this article are for informational purposes only. They do not offer financial, investment, or other advice. Investing or trading crypto assets involves the risk of financial loss.




