
 Dacity Coin
 Celestia
 Quantus
 Bitcoin
 Pearl
Pearl Pons
Pons Injective
- The long/short liquidation of the LTC coin is 0.967
- The MACD for the LTC coin is forming a negative crossover.
Litecoin (LTC) is often regarded as the inaugural and successful alternative cryptocurrency (altcoin), originating in 2011 as a fork of Bitcoin.
It facilitates nearly cost-free peer-to-peer transactions, distinguishing itself from the leading cryptocurrency. Through features such as shorter transaction confirmation times, decreased fees, an expanded maximum supply of 84 million LTC, and various distinct technical characteristics.
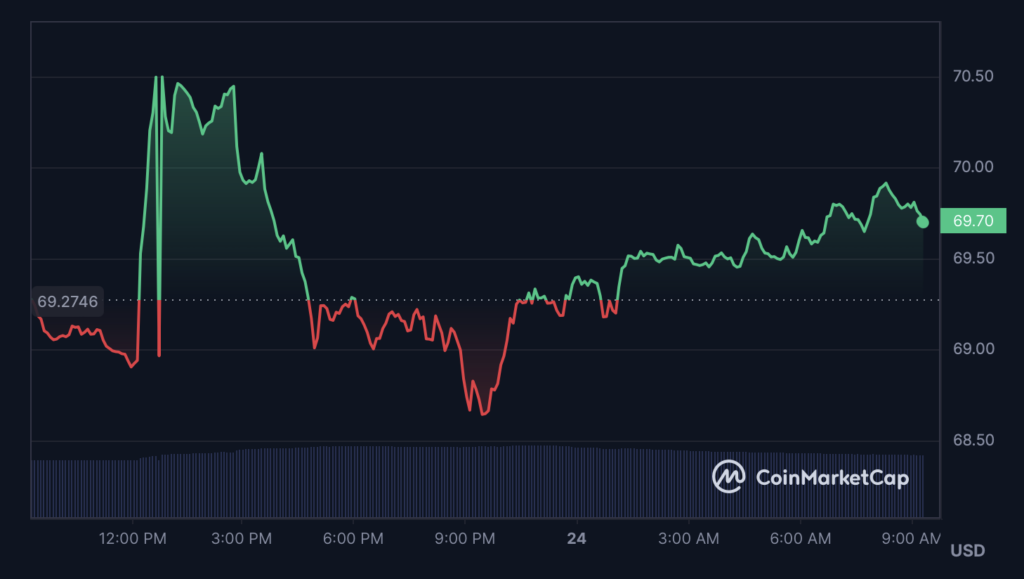
Financials of the LTC Coin
The current valuation of LTC coins stands at $69.66, reflecting a 0.66% uptick in the last 24 hours, with a total circulating supply of 73 Million coins.
The 12-hour long liquidation for LTC is $19.13K, while the short liquidation is $5.66K, resulting in a long/short ratio of 0.967. The higher long liquidation compared to short suggests that buyers are exiting their positions more actively.
The open interest for LTC is $245 Million, witnessing a 1.11% decline in the past 24 hours, and the volume/market cap ratio is 0.06.
In the last year, LTC experienced a decline of more than 11%, indicating weak performance by the coin.
Technical Indicator Summary Tool
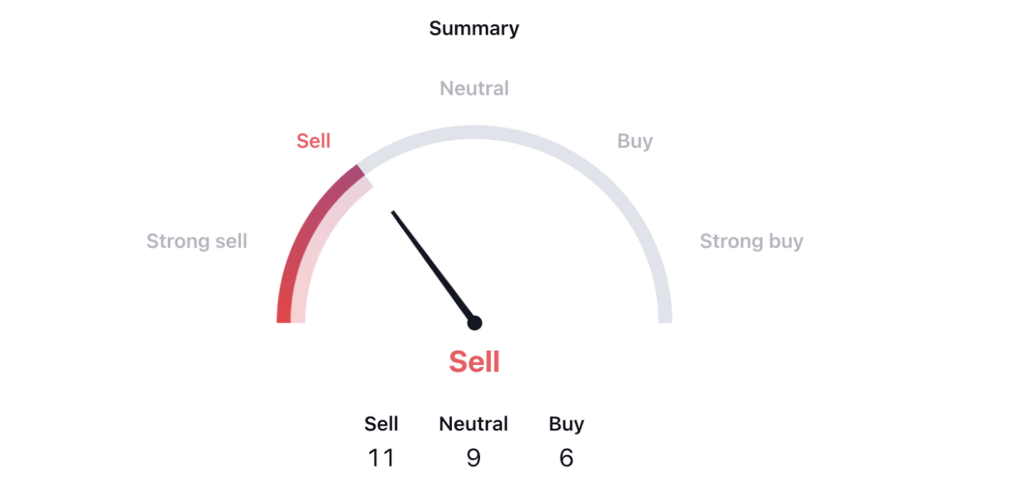
As per the technical indicator summary tool, the LTC coin is showing a sell signal. Out of the 26 indicators, 11 suggest a sell signal, promoting the increase of bearish sentiments in the market.
Litecoin (LTC) Technical Analysis
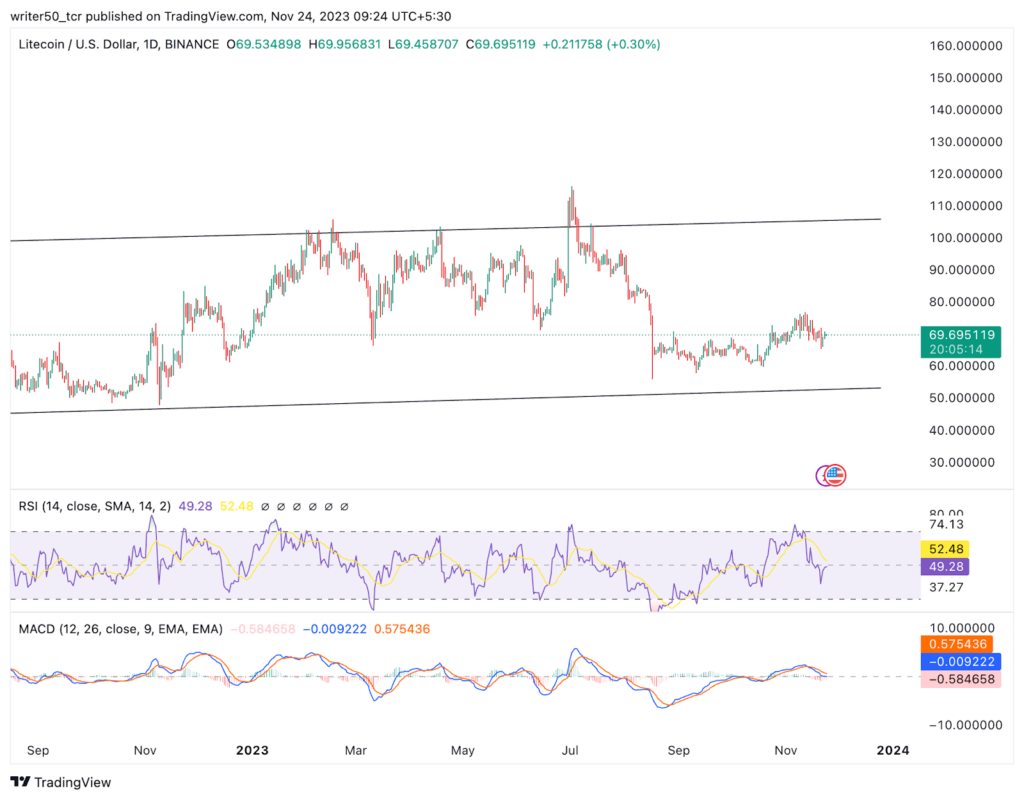
The LTC coin’s current market price exhibits a bearish signal as it forms a lower-low pattern, finding support at the $44.6 level following a substantial 90% decline.
The coin is presently within a channel pattern, token price experienced a decline near the resistance level.
The overall pattern suggests a potential downward trajectory and a breach below the support level could indicate further bearish momentum.
Technical Indicators Overview
The LTC coin’s MACD line is positioned below the signal line, accompanied by the formation of a red histogram, signaling a bearish trend with a potential downward movement in the coming days.
The RSI line is at the 49 level, trading below the SMA line, indicating a negative pattern for the coin.
Conclusion
The LTC coin analysis indicates a bearish signal, with the price retracing following resistance. Additionally, negative indicators contribute to the coin’s weakened outlook. The elevated long liquidation suggests a potential decline in the coin’s value in the coming days, especially if it breaches the support level.
Technical Levels
- Support Levels: $58.23 and $49.24
- Resistance Levels: $75.68 and $95.9
Disclaimer
The views and opinions of the author, or anyone named in this article, are for informational purposes only. They do not offer financial, investment, or other advice. Investing or trading crypto assets involves the risk of financial loss.




