
 Quack AI
 NEAR Protocol
 Pudgy Penguins
 Pearl
Pearl Quant
Quant Quantus
 Sui
Sui
- The SNX crypto price has witnessed a decline of 2.70% in the last 24 hours.
- The Synthetic crypto is following an uptrend on the daily charts.
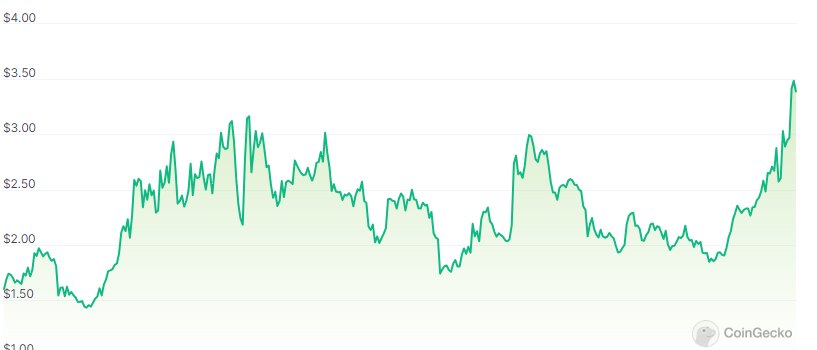
The SNX crypto has a circulating supply of 289.253M SNX followed by a total supply of 327.216M SNX. The fully diluted market cap of the Synthetic crypto is $1.112B.
This cryptocurrency’s trading volume has declined by 28.27% in the last 24 hours and the derivatives trading volume has declined by 8.5%. The following long/short ratio of the crypto is 0.929.
The Synthetic crypto has witnessed a long liquidation of $413.42K, which is much higher than the short liquidation. This behavior in the derivatives data represents that the sellers have been dominating in the last 24 hours.
The current market cap rank of SNX token as per Coingecko is #54 and the market cap dominance of the crypto is 0.076%. The market cap of Synthetic crypto has witnessed a decline of 8.10% in the last 24 hours. It indicates that the crypto price is witnessing a decline.
Token Contract Overview
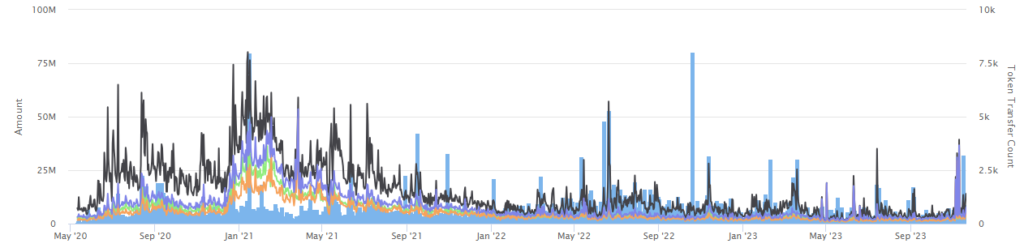
Over the last few days, the Synthetic token has witnessed an advance in the contracts trend. The transfer amount of contracts has advanced from 1.322M on 3rd November 2023 to 32.101M SNX on 16th November 2023.
Revenue vs TVL Of Synthetic Crypto
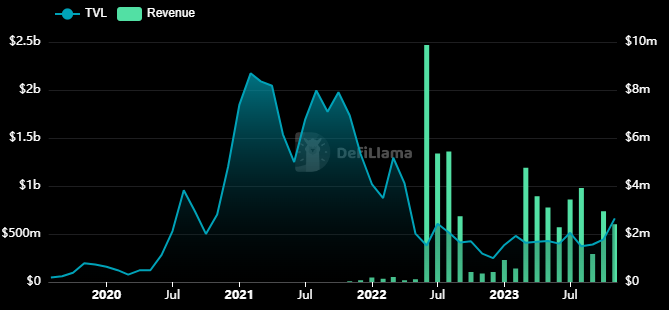
Based on the most recent scenario, the revenue of the company is constant following the same trend as fees. The TVL of the crypto has also witnessed a decline over the years. It has resulted in a TVL of $594.16M and is gaining momentum again.
Technical Analysis of the SNX Crypto
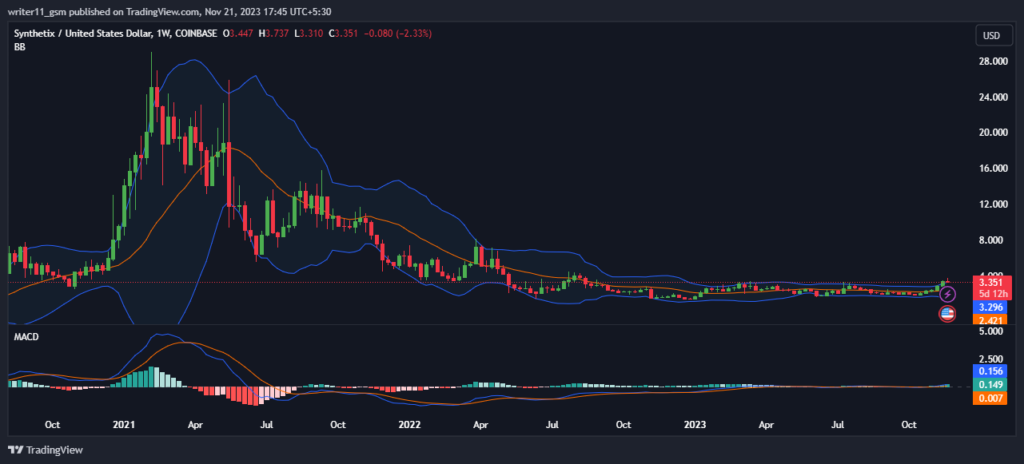
The SNX crypto has been making lower lows for a long time. This behavior of the crypto price and the selling pressure has led to a decline of more than 90% in the crypto price.
The SNX token on the daily charts is making a higher high pattern on the charts and has recently broken above the major resistance. This behavior of the crypto price shows that it is currently following a strong uptrend.
The SNX crypto price has broken out above the Bollinger band and has moved far ahead of the baseline. The following behavior of the crypto represents that it is following an uptrend but can come for a small retracement and might touch the baseline.
The MACD on the daily charts of the SNX token is trading in a golden cross, indicating a bullish signal. It shows bullish momentum as the signal line is trading above level 1.
SNX/USD Chart ByTradingView
Conclusion
The SNX crypto, despite recent short-term declines, demonstrates strong bullish indicators. With an uptrend in daily charts, a breakout above resistance, and positive signals from MACD, the SNX coin appears poised for an upward trajectory. Traders may anticipate potential retracement but overall bullish momentum prevails.
Technical Levels
- Support levels- $1.8 and $2.20
- Resistance levels- $ 4.0 and $7.2
Disclaimer
The views and opinions stated by the author or any other person named in this article, are for informational purposes only and do not constitute financial, investment, or other advice. Investing in or trading crypto or stocks comes with a risk of financial loss.




