
 Injective
 Celestia
 streamoors
 Sui
Sui Pudgy Penguins
 Bitcoin
 Pearl
Pearl
- In the last 7 days, OKB crypto has lost its value by 7%.
- The trading volume of the OKB crypto is witnessing advance followed by the last 24 hours.
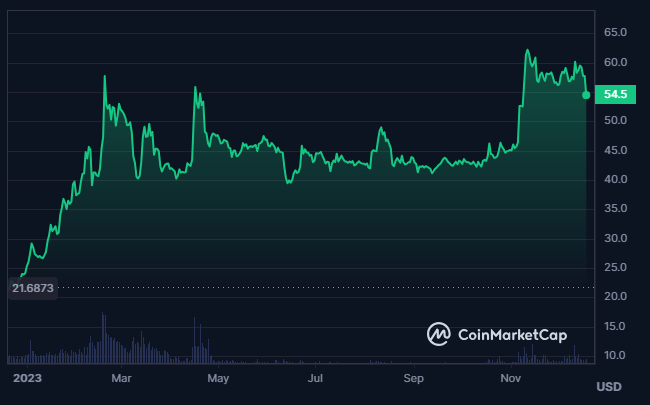
OKB is OKX’s utility token that offers benefits to its holders, such as discounts, passive income, and access to token sales. It was created by Star Xu and Jay Hao, the founders and CEOs of OKX and OKCoin. OKB has a buy-back and burn program to preserve its value.
OKB crypto is a layer 1 blockchain built on the Ethereum platform and uses ERC 20 token standards. Its current market cap rank as per CoinMarketCap is #25 and its traded volume ranking of #379 in the last 24 hours.
The market cap of the crypto has declined by 5.3% in the last 24 hours which results in $3.227B. Moreover, the trading volume has advanced by 50%. With the advance in volume, the declining price represents the possibility of further price decline.
The volume/market cap ratio of the OKB crypto is 0.21% and the market cap dominance of the crypto is 0.2%. Also, the crypto hit its all-time low price almost five years ago.
OKB Token Overview
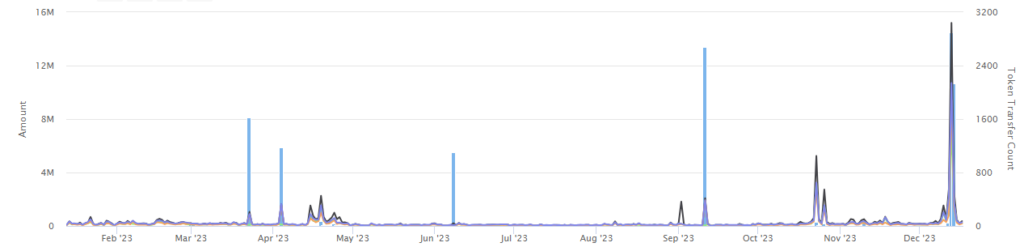
The OKB token has 51.6K holders, which have advanced by 0.668% in the last few days. This resulted in a total transfer of 143.3K.
The token has a fully diluted market cap of $16.236B and a circulating supply of 60.0M OKB. Moreover, the max total supply of the crypto is 300.0M OKB and the circulating supply market cap of the crypto is $3.247B.
OKB Crypto Technical Analysis
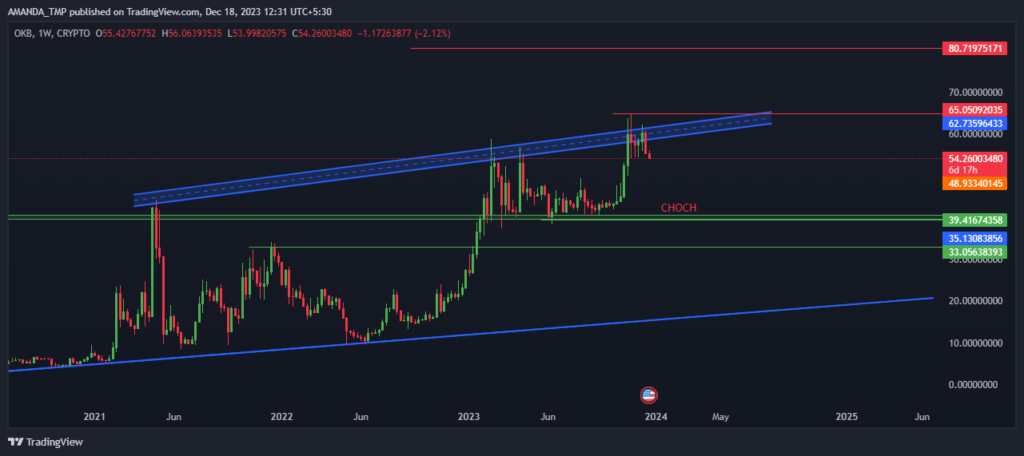
The OKB crypto recently hit its all-time high price of $64.92 and is down by only 16.7% from its all-time high price. The crypto price also has been following a strong uptrend which has led to the formation of the expanding wedge pattern.
The OKB crypto price has hit the upper zone of the expanding wedge pattern and is currently facing resistance at the higher levels and has formed a bearish candlestick pattern.
OKB/USD Chart by TradingView
The OKB crypto price has declined below the median line of the Bollinger Band indicator which represents that the trend of the crypto is shifting to the downside. It also has broken below the previous swing low.
The MACD on the daily charts is also leading toward below-zero levels following the death crossover. It also has formed bearish volume blocks on the chart. This behavior shows that the sentiment of the crypto price is shifting to bearish.
Conclusion
The OKB crypto has shown a remarkable performance in the past year, reaching new highs and gaining popularity among investors. However, the recent technical analysis suggests that the bullish rally may be over for now, as the crypto faces strong resistance at the higher band of the wedge pattern.
The OKB crypto price may continue to decline in the short term unless it can break above the upper trend line of the expanding wedge pattern and regain its momentum.
Technical Levels
- Support levels- $33.05 and $39.416
- Resistance levels- $65.00 and $80.00
Disclaimer
The views and opinions stated by the author or any other person named in this article, are for informational purposes only and do not constitute financial, investment, or other advice. Investing in or trading crypto or stocks comes with a risk of financial loss.




