
 Bitcoin
 Aerodrome Finance
 Zerebro
 Starknet
 Zama
Zama Pearl
Pearl ZKsync
- The TIA crypto has witnessed higher long liquidations in the last 24 hours.
- The trading volume of the Celestia crypto is also declining.
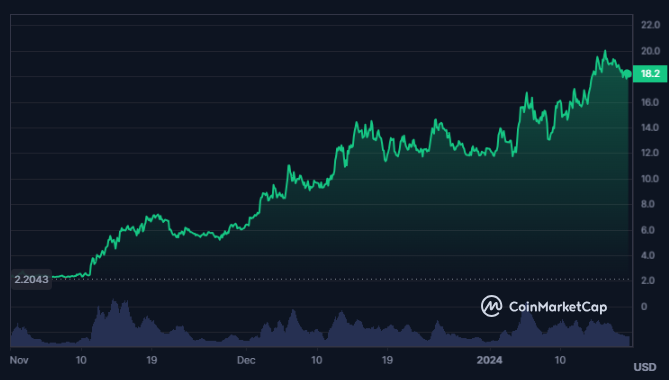
Celestia is a modular data availability network that enables anyone to launch their own blockchain. It uses data availability sampling to increase scalability and $TIA to pay for data, bootstrap rollups, stake for security, and participate in governance. It is based on Cosmos SDK and CometBFT.
The current circulating supply of the Celestia crypto is 158.139 Million TIA and the max supply of the crypto is not defined. The trading volume of the crypto has further declined by 17% in the last 24 hours.
The volume/market cap ratio of the Celestia crypto is 7.11% against the market cap of $2.883 Billion, which makes it the 33rd largest cryptocurrency in the global cryptocurrency market.
At press time, the current market cap dominance of Celestia is 0.163% and the fully diluted market cap of the crypto is $18.433 Billion. This is followed by a total supply of 1.17 Billion TIA and the crypto price is 775% above its all-time low.
Celestia Derivatives Analysis
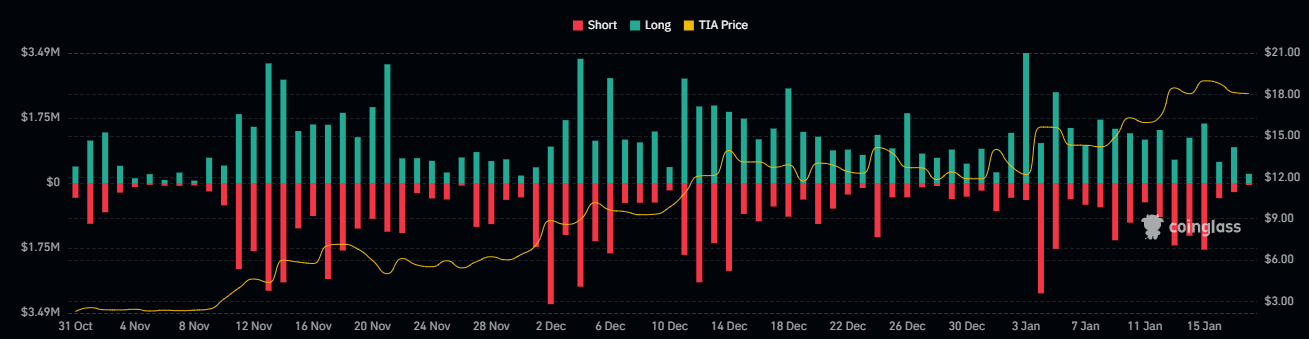
The open interest of the TIA crypto has declined by 6.1% in the last 24 hours with a decline of 17.6% in the derivatives trading volume of the crypto. Moreover, the long/short ratio for the Celestia crypto is 0.9272.
With a decline of 2% in the trading price, the Celestia crypto price has witnessed a long liquidation of $780.71K. Additionally, the recorded short liquidation for the crypto as per Coinglass is worth $269.63K.
TIA Crypto Technical Analysis
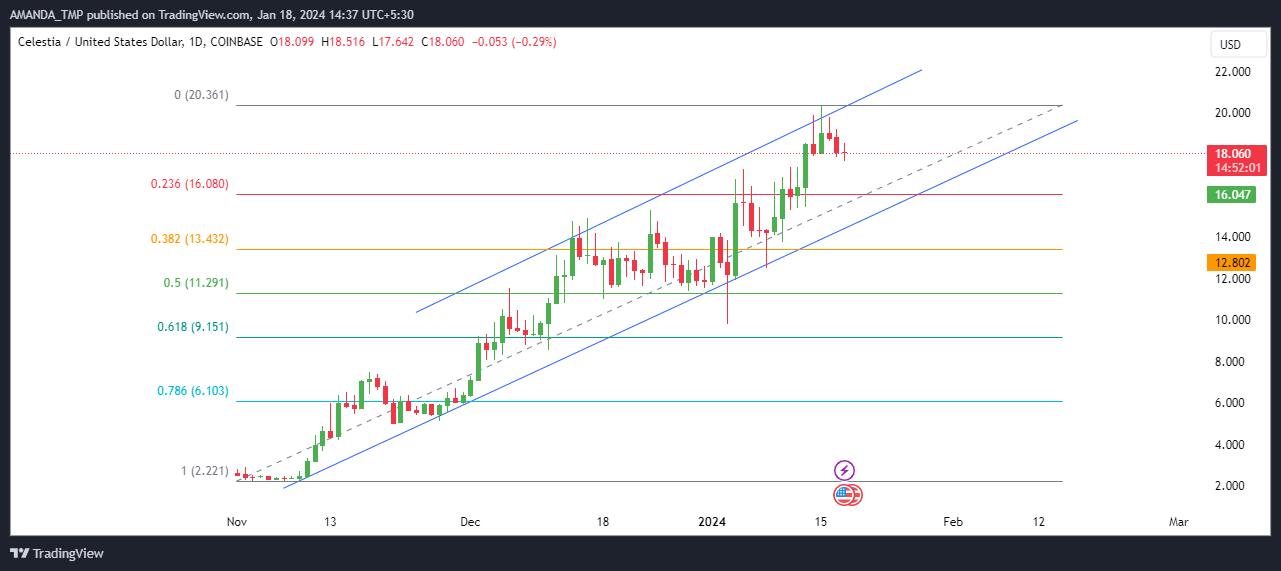
The Celestia crypto price is consistently rising to higher levels by moving inside a rising channel and it has hit the higher side of the rising band.
Based upon the current position of the TIA crypto price and the formation of the candlestick pattern, we might witness a decline in the price in the short-term. The price of the crypto might decline to the lower band of the rising wedge pattern.
This decline in the price would be considered as a retracement as it is a part of price moment cycle unless it breaks below the rising wedge pattern.
TIA/USD Chart by TradingView.com
The technical indicators on the 4H chart represent a loss of momentum in the price. The TIA crypto price has declined below 20-day EMA while the 50-day and the 200-day EMAs are forming a golden cross pattern.
The MACD and the signal lines are forming a bearish cross while they are above the zero level.
The RSI has declined below the 50-level and the 14-day SMA, indicating a possibility of decline in the price. The price of the crypto can be considered weak unless the RSI breaks above the 50-level.
Summary
TIA crypto has seen a decline in volume, open interest, and price. The technical analysis suggests a possible retracement to the lower band of the rising wedge pattern. Traders should be cautious and watch the RSI and MACD indicators before looking for any bullish opportunities.
Disclaimer
This article is for informational purposes only and does not provide any financial, investment, or other advice. The author or any people mentioned in this article are not responsible for any financial loss that may occur from investing in or trading. Please do your research before making any financial decisions.




