
 streamoors
 Altai the Tiger
 Sword Inu
 IGNITION
 no crying in the casino
 Quantus
 NEAR Protocol
- Over the last seven days, the SOL crypto price fell 6.8%.
- The trading volume has been on the rise in the last 24 hours.
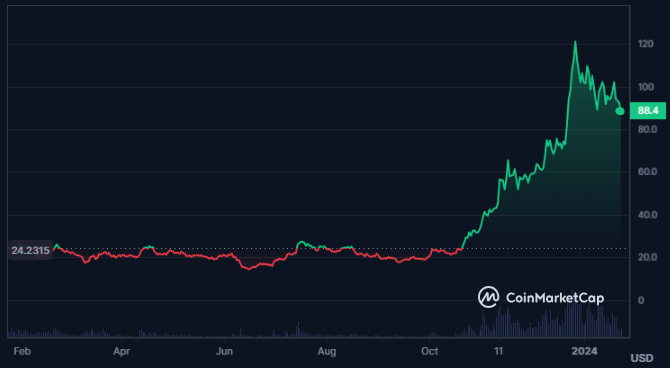
Solana is a fast and scalable blockchain that uses PoH and dPoS to achieve decentralization and security. SOL is the native token that pays for fees, enables smart contracts, and rewards stakers. Solana supports various dApps that create new use cases for SOL.
The SOL crypto price is trading 17550% above its all-time low of $0.5008 formed over three years ago. The last seven days trading price range of the Solana crypto is $88.03-$102.06.
The trading volume of Solana has advanced by 29.1% in the last 24 hours ranking 6th in the global cryptocurrency market as per CoinMarketCap.
The market cap of Solana is $38.201 Billion which makes it 5th largest cryptocurrency globally which further has witnessed a decline of 5.15% in the last 24 hours.
The max supply of the Solana is undefined while the total supply of the crypto is 567.727 Million SOL. Moreover, the circulating supply of the crypto is 433.026 MillionSOL followed by a volume/market cap ratio of 3.36%.
With a fully diluted market cap of $50.055B, the open interest for the crypto has declined by 2.14% in the last 24 hours. Moreover, the derivatives traded volume of the crypto has advanced by 36.6% wrestling in $3.29B.
Solana Blockchain Data Overview
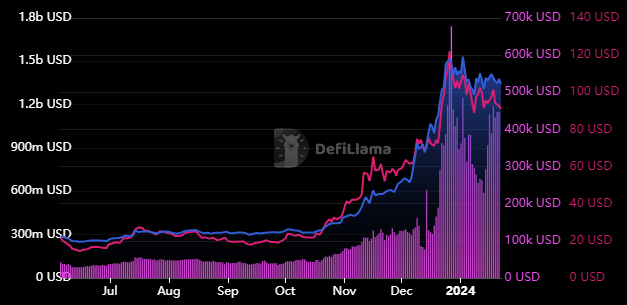
The market cap of the crypto has declined by $1.919 Billion and the fees earned in the last 24 hours stood at $446K. Also, the revenue of the crypto is $223K followed by an inflow of $81K in the last 24 hours.
SOL Crypto Technical Analysis
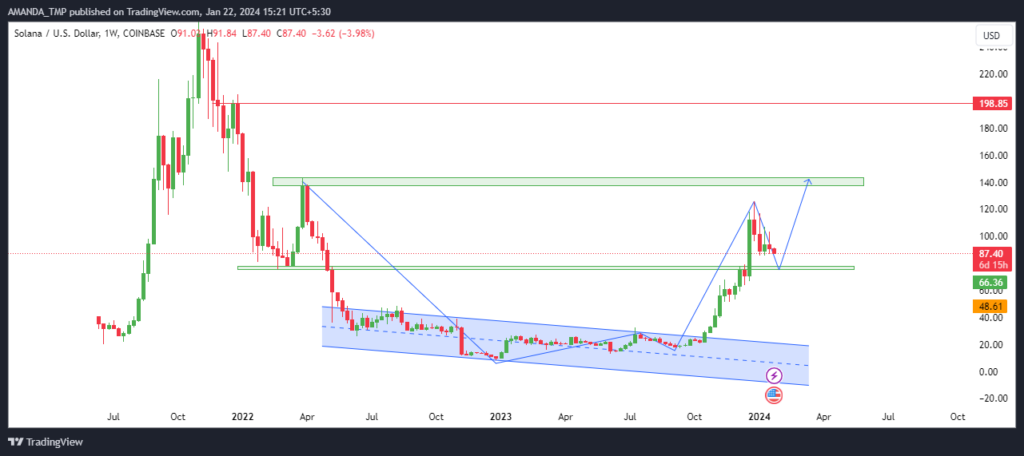
The SOL crypto price can be seen following a strong uptrend as it has broken above the last swing highs. Despite this advance in the crypto price, the crypto is currently witnessing a profit booking but the price is trading above the 50% level of the overall rise.
The following price behavior of the crypto shows strength in the crypto and the possibility that the price might rebound from the lows.
SOL/USD Chart by TradingView
The profit booking in SOL crypto price has led to the decline below the 50-Day EMA, but the price of the crypto is still following an uptrend. This is because the EMAs are trading in a golden cross and the price is still trading above the 200-Day EMA.
The MACD is indicating bearishness on the charts as the MACD and the signal line are trading in a death cross and slid toward the zero level, forming bearish histograms.
The RSI for the crypto has declined to 43.19 from the overbought zones leading to a downtrend on the chart. The RSI line also had declined below the 14-Day SMA.
Summary
The SOL price is in a strong uptrend and has broken above the last swing highs. The technical indicators suggest a possible rebound from the profit booking and a continuation of the rally which might lead to higher levels in the SOL crypto price.
Disclaimer
This article is for informational purposes only and does not provide any financial, investment, or other advice. The author or any people mentioned in this article are not responsible for any financial loss that may occur from investing in or trading. Please do your research before making any financial decisions.




