
 Dacity Coin
 Pearl
Pearl Bitcoin
 Injective
 Pudgy Penguins
 Quantus
 Starknet
- The TIA token price witnessed a reversal and rebounded from the demand zone of the $8 mark.
- Celestia token’s price has surged over 40% this month, which depicts bullish momentum.
The Celestia (TIA) token price revealed buying momentum and is eyeing to cross the 200-day EMA mark. This month, the token has reverted from the bottom mark of $8 and witnessed a trend reversal.
Amidst the market recovery, the token has recovered over 40% this month and regained bullish momentum. A break and close above the 200-day EMA mark would soon trigger a sharp upmove toward the $15 mark.
The market sentiment favored the bulls, and the TIA token can gradually stretch the up move and might accelerate the bullish moves ahead.
At press time, the Celestia (TIA) price traded at $11.07 with an intraday drop of 2.10%, reflecting neutrality on the charts. It has a monthly return ratio of -14.30% and a yearly return ratio of 288.30%.
The pair of TIA/BTC is at 0.000162 BTC, and the market cap is $1.55 Billion. Analysts are neutral and suggest that the TIA price may surpass the 200-day EMA mark and outperform in the coming sessions.
Celestia Looks Promising to Go Long Ahead: Key Metrics Outlook
The TIA token price was in a correction phase for weeks, erasing over 40% of gains in the past two months. Recently, the token has settled a base formation around the $8 mark and defied the selloff.
After a long time, the key metrics have turned bullish, suggesting a potential bull run is on the cards.
Source: Santiment
This week, the token has revealed fresh follow on buying and sustained above the $10 mark. Buyers have gained traction and are looking to cross the 200-day EMA mark.
A recent tweet by @Altcoin Sherpa analyses that the TIA price has filled the gap region and might reflect a breakout above the $12.50 mark.
$TIA filled https://t.co/q0vJorEb6T pic.twitter.com/hBTVjxqUq6
— Altcoin Sherpa (@AltcoinSherpa) May 29, 2024
Source: X
The Momentum Indicator (RSI) curve spiked to the overbought zone, and a bullish crossover was witnessed on the charts.
In addition, the trading volume significantly surged over 34.28% to $274 Million in the last 24 hrs. White, the token has ranked at 65 per the market cap and has a total supply value of 1 billion.
Sharp Surge in Price Volatility
This week, the price volatility sharply rose over 280% and reached the 0.042 mark, implying investor speculation.
Source: Santiment
Likewise, the weighted sentiment value rose over 342% to the 0.971 mark, conveying a positive outlook among the investors.
This sudden spike in these key metrics revealed the optimistic outlook and indication of a possible bullishness ahead.
Development Activity Data Conveys Consistent Growth
For weeks, the development activity value kept on growing, implying a significant rise. The value soared over 32% to 136, reflecting the positive outlook.
Source: Santiment
Additionally, social dominance sharply spiked from 21.90% to 0.244%, signifying the surge in popularity among investors on social platforms.
Future Open Interest Data Reveals Short Covering
The recent surge in the TIA token impacted the sellers’ short positions and looked trapped, which led to short covering.
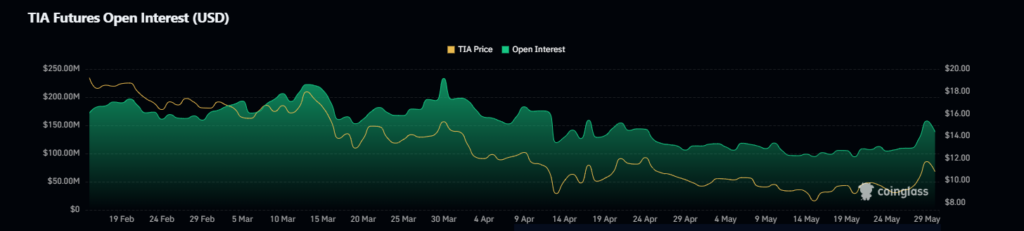
The open interest data dropped over 7.78% to $143.57 Million in the past 24 hours, signifying the upcoming surge.
The immediate support levels for the Celestia (TIA) price are $10 and $8.70, whereas the key upside hurdle is around $11.80, followed by $13.
Conclusion
The Celestia price has returned from the bottom and picked momentum in the past sessions. Moreover, signs of trend reversal were witnessed, and buyers gained traction.
Disclaimer
This article is for informational purposes only and provides no financial, investment, or other advice. The author or any people mentioned in this article are not responsible for any financial loss that may occur from investing in or trading. Please do your research before making any financial decisions.




