
 NEAR Protocol
 Bitcoin
 Aerodrome Finance
 Pearl
Pearl Uniswap
 Quantus
 Pudgy Penguins
- Mantle token was outperformed by 56% of the top 100 crypto assets in the last 1 year.
- MNT token has huge liquidity based on its market cap.
The price of Mantle token is 170% above its all-time low price of $0.3136 which was achieved nine months ago.
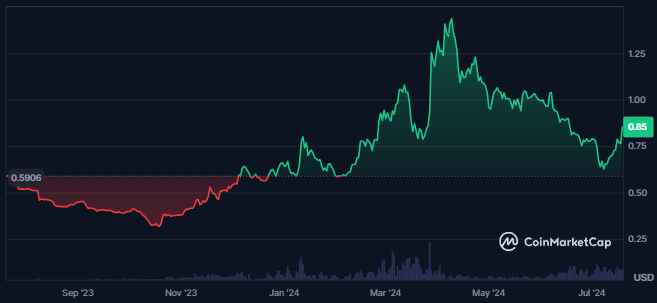
Price Overview Chart of MNT | Source: CoinMarketCap
The market cap and the value of the traded volume of the MNT has advanced together, showing a surge in the demand for the token. Following this, the market cap of the token has advanced by 7.43% in the last 24 hours.
The market cap value of the token is $2.79 Billion and the value of the traded volume for the token is $246.878 Million. This results in a volume/market cap ratio of 8.93%, showing good liquidity in the token price.
The fear and greed index further is at 60 showing greed among the investors while the sentiment of the token is neutral as per Coincodex. Also, the market cap dominance of the token is 0.12% which represents its strong market presence as Mantle is the 33rd largest cryptocurrency in the global crypto market.
The total value locked for the token is $605.12 Million which has consistently advanced over time and is at its all-time high at press time. Also, the stablecoins market cap of the token is $183.54 Million and the treasury of the token is worth $845.67 Million.
Mantle Token Derivatives Data Analysis
The traded volume surged 210% to $24.72 Million in the last 24 hours from press time..
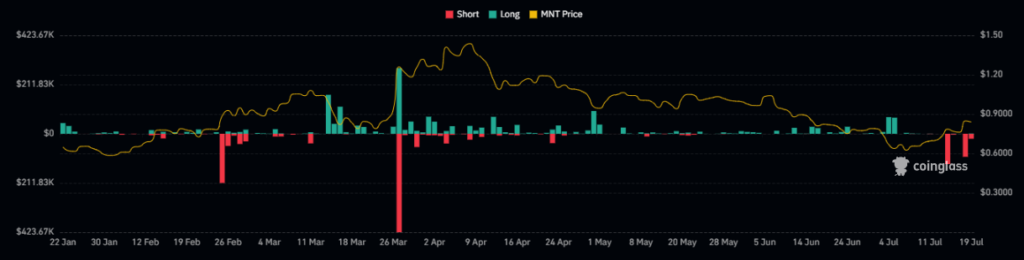
Mantle Token Derivatives Liquidation Chart | Source: Coinglass
The open interest of the token has further rose by 22% in the last 24 hours which again shows a surge in the number of open positions for the crypto.
Higher short liquidations in the token were recorded against which the amount of longs liquidated is much less. This represents the strong dominance of bulls in the Mantle token’s price.
MNT Token Technical Analysis
MNT is following a strong downtrend for a long time followed by the formation of lower highs on the daily chart.
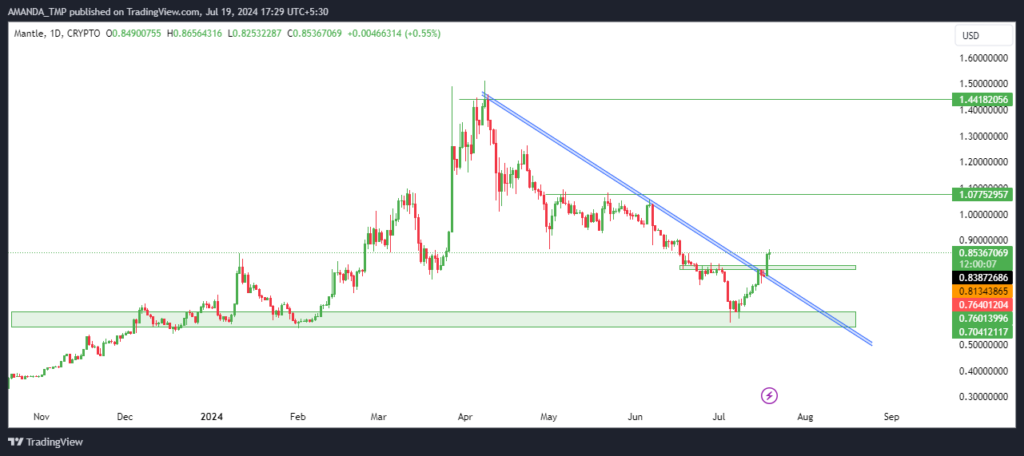
MNT Token Daily Price Chart | Source: Tradingview
The declining price formed a descending triangle pattern on the chart followed by multiple resistances levels on the higher level.
After consistently declining from the higher levels, the price of the token took support at a crucial level and started to reverse. In just the last 13 days, the price of the token was up by 35% and broke above multiple resistances.
The following behavior of the token’s price reflects strength and volume, followed by bulls dominance.
MNT/USD Chart by TradingView
MNT token broke above the 50-day and the 200-day EMAs as the EMAs trade in a death cross. If the price continues to rise, we might get to see a golden cross in future.
The MACD and the signal line further are trading in a golden cross but still sustain below the zero level. This shows neutrality in the token price.
The RSI further shows a surge in the momentum of the token price as it has broken above the 50-level. It also has broken above the 14-day SMA and has given closing at the higher levels.
MNT surged 35% in 13 days, breaking multiple resistance levels. With strong buying support, increased open interest, and bullish technical indicators like RSI and MACD,
The token’s market cap and liquidity are also rising, indicating strong investor interest. MNT token might take support at the levels of $0.450 and $0.60 followed by the resistances of $1.070 and $1.440.
Disclaimer
This article is for informational purposes only and does not provide any financial, investment, or other advice. The author or any people mentioned in this article are not responsible for any financial loss that may occur from inves




