
 Dacity Coin
 Bitcoin
 Pearl
Pearl NEAR Protocol
 Quantus
 Bittensor
 Pudgy Penguins
- BOME token traded in green for 16 days in the last 30 days.
- Bank Of Meme token price is down by 61% from its all-time high.
The Book Of Meme token price was highly volatile (9.46%). Its market cap dominance of the token was 0.03%.
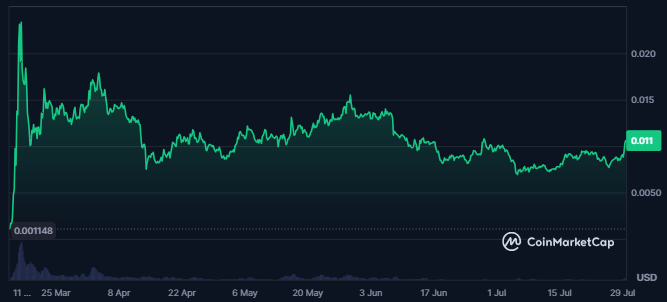
A 180% surge in the token’s traded value was recorded in the last 24 hours. This resulted in a traded value of 351.33 Million is 47.7% of the token’s market cap.
The Book Of Meme token’s market cap value was $727.746 Million with a market cap ranking of #95 on CoinMarketCap. The token’s market cap also advanced by 19% in the last 24 hours.
The sentiment for Book Of Meme token price was bullish, while the fear and greed index index of the token was at 74.
There were a total of 82.1K holders of the token and the top 10% of the holders had 72.49% of the token’s total supply. At press time, the largest holder of the token had 53.67% of the supply alone resulting in 37.029 Billion BOME.
The security score of Book Of Meme token was 51.89. It belongs to the CCC tier. Also, the security ranking of the token was #6392, and the market security score of the token was strong (92.43)
Book Of Meme Token Derivatives Data Analysis
The derivatives traded volume of the token also witnessed a huge surge resulting in a traded value of $888.12 Million followed by a 405% surge. This showed the strong engagement of the traders in the token.
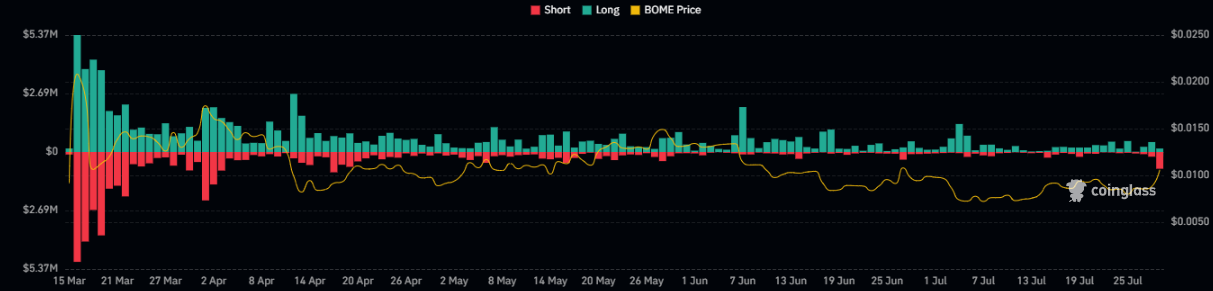
The liquidation chart of the Book Of Meme token showed a surge in the short liquidity of the token.
A 72% surge in the open interest of the token was recorded, reflecting a rise in the number of open positions of the token. Also, the shorts recorded for the token were worth $924.83K against which longs worth only $515.44K were liquidated in the last 24 hours.
BOME Token Technical Analysis
The price of BOME token rose to higher levels over the last few days following a surge in the trading volume, highlighting the trend strength.
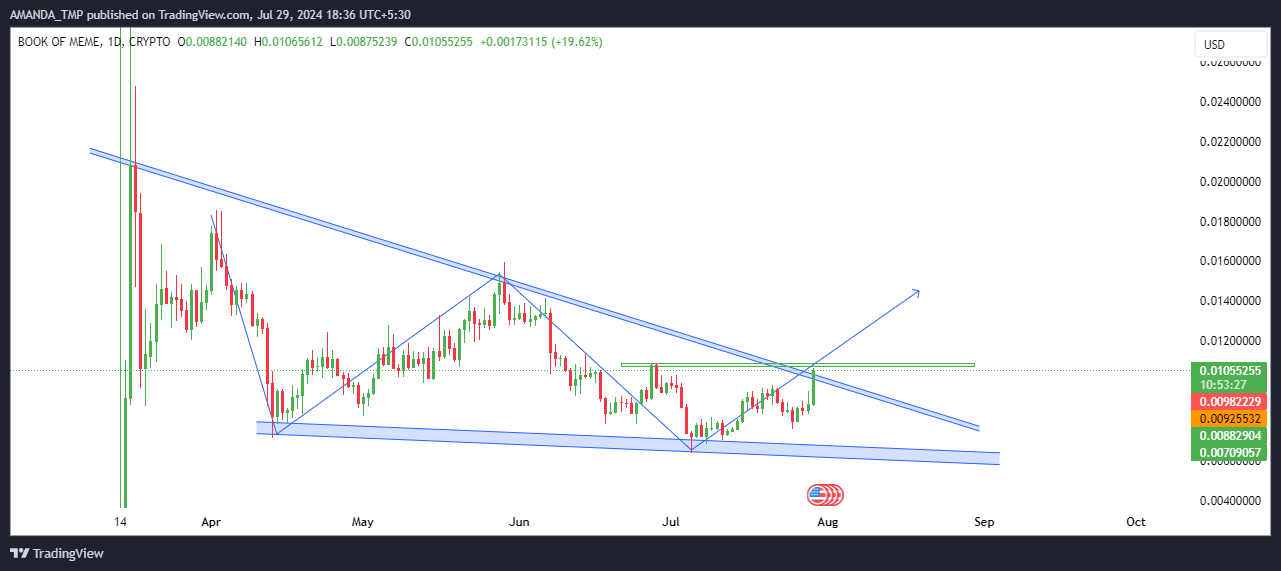
For the last four months from the press time, the BOME token price witnessed profit booking from the higher levels. This following behavior of the token price led to the formation of a descending triangle pattern.
The price of the token further broke out above the pattern with strong momentum followed by a rise in the trading volume.
BOME Token Technical Analysis
BOME/USD Chart by TradingView.com
Although the 20-day and the 50-day EMAs on the daily chart traded in a death cross, the price of the token broke out above the following EMAs.
The MACD advanced to the median level and its metrics traded in a bullish crossover. This was supported by bullish histograms on the chart. The RSI advanced above the 50-level and the 14-day SMA. This showed a surge in the token’s price momentum.
BOME shows strong bullish potential, trading in green for 16 out of the last 30 days. With a recent 180% surge in traded value and a 19% rise in market cap, technical indicators including the MACD and RSI suggest significant upward momentum. Multifold returns could be ahead.
The support levels for BOME are $0.00060 and $0.0060, followed by the resistance from $0.0150 and $0.0180 marks.
Disclaimer
This article is for informational purposes only and does not provide any financial, investment, or other advice. The author or any people mentioned in this article are not responsible for any financial loss that may occur from investing in or trading. Please do your research before making any financial decisions.




