
 Altai the Tiger
 Sword Inu
 streamoors
 IGNITION
 NEAR Protocol
 Pearl
Pearl Injective
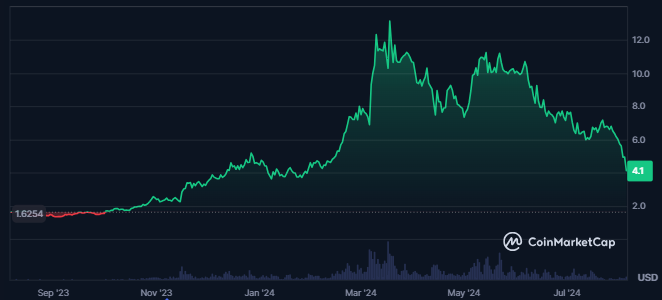
- In just the last 7 days, the RNDR token price had declined by 36%.
- The annual inflation rate of the Render token was high at 6.18%.
The market cap dominance of the Render token was 0.09%, which represents a good presence of the token in the global crypto market. The token’s price volatility was certainly high at 8.25%.
At the time of writing, Render had a total of 23.9K holders, and a decline in the number of holders was recorded over time. Also, the largest holder of the token had 0.05% of the total supply, resulting in 252K.
Additionally, the traded volume of the RNDR token advanced by 94% in just the last 24 hours. It resulted in a traded value of $118.47M, against which the token’s market cap declined by 16.3%.
Render was the 41st largest cryptocurrency in the global crypto market at the time of writing. Its market cap was $1.635B. The declining market cap and rising volume further represented a gain in the token’s price downtrend.
Following the recent decline in the crypto market, the RNDR token price dropped by 69% from its all-time high of $13.60. Additionally, the token’s all-time high price was achieved five months ago.
Render Token Derivatives Data Analysis
The open interest of the Render token witnessed a decline of 31% in just the last 24 hours. It decreased the token’s open positions, showing a lack of traders’ confidence.
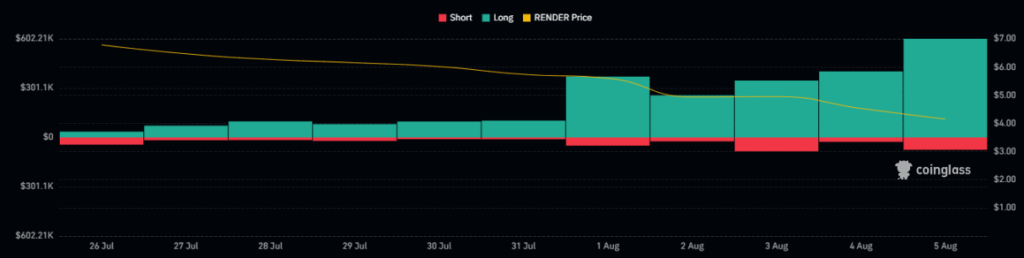
The token witnessed higher long liquidations over the last few days, and even in the previous 24 hours, longs worth $939.55K were liquidated. Against this, the shorts of $79.66K were liquidated, showing the bear dominance in the token.
The derivatives traded volume of the token witnessed an advance of 40%, resulting in a traded value of $138.22M.
RNDR Token Technical Analysis
The RNDR token price witnessed consistent profit booking for the last five months.
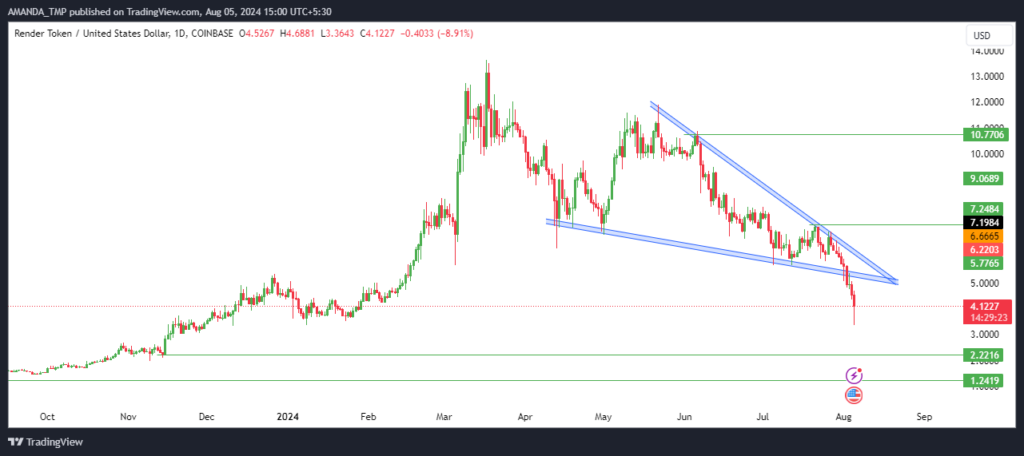
That behavior of the RNDR token price led to a descending triangle pattern. Also, the token price started to witness profit booking since March 2024. Its price declined by 70% from the swing high of $13.62.
Moreover, the most recent price action of the RNDR token price showed a breakdown in the price, showing sellers’ dominance. It might lead the token price to lower levels in the future.
Render Token Technical Indicators Analysis
The RNDR token price has consistently traded below the 200-day EMA for the last 30 days. It was followed by a death cross of the 50-day and the 200-day EMAs on the daily chart, exhibiting a bearish trend.
RNDR/USD Chart by TradingView
The MACD and the signal line traded in a death crossover, and both metrics traded in a negative trajectory.
The RSI also declined below the 50-level and the 14-day SMA and traded in an oversold zone. It exhibited a bearish cycle in the token price.
Disclaimer
This article is for informational purposes only and does not provide any financial, investment, or other advice. The author or any people mentioned in this article are not responsible for any financial loss that may occur from investing in or trading. Please do your research before making any financial decisions.




