
 Boomer
 hi
hi Covenant x402
 NEAR Protocol
 Injective
 Quantus
 Solana
- The Stellar token price is 8200% above its all-time low price.
- XLM was trading in green for 17 days in the last 30 days.
XLM has outperformed 87% of the top 100 crypto assets, including Bitcoin and Ethereum, in the last 1 year.
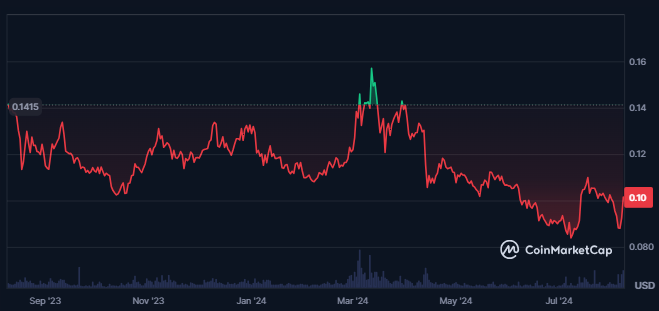
The Stellar token market cap has advanced by 9.05% in the last 24 hours, resulting in a market cap value of $2.982. This further resulted in a market cap ranking of #26, and the token’s market cap dominance was 0.09%.
As per the analysts, the token’s sentiment was bearish. While the fear and greed index was at 20, extreme fear was shown among the token investors. This showed that investors were loading off the token at lower prices.
At press time, 58.8% of the maximum supply of Stellar tokens circulated in the market. This was followed by a total supply of 50.001B XLM. Also, the token’s total and maximum supply were the same, and the circulating supply was 29.399B XLM.
Stellar Token Derivatives Analysis
Shorts worth $149.8K were liquidated in the token in the last 24 hours, against which longs worth $207.91K were liquidated. This indicated huge profit booking in the long positions of the traders and the investors.
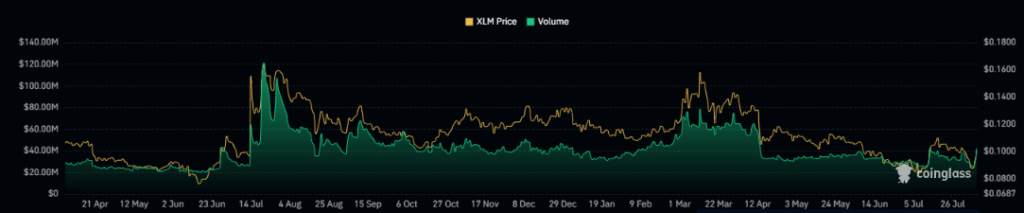
The open interest for the token has advanced by 45% in the last 24 hours from the time of writing. This showed that the traders and investors added more positions.
The value of the derivatives traded volume for the token also advanced by 300% in the last 24 hours, resulting in a traded value of $333.18 Million. This showed a huge demand for the token’s derivatives.
XLM Token Technical Analysis
XLM experienced a steady decline for an extended period, forming a series of lower lows within a falling wedge pattern on the daily chart. This common technical formation often precedes a reversal.
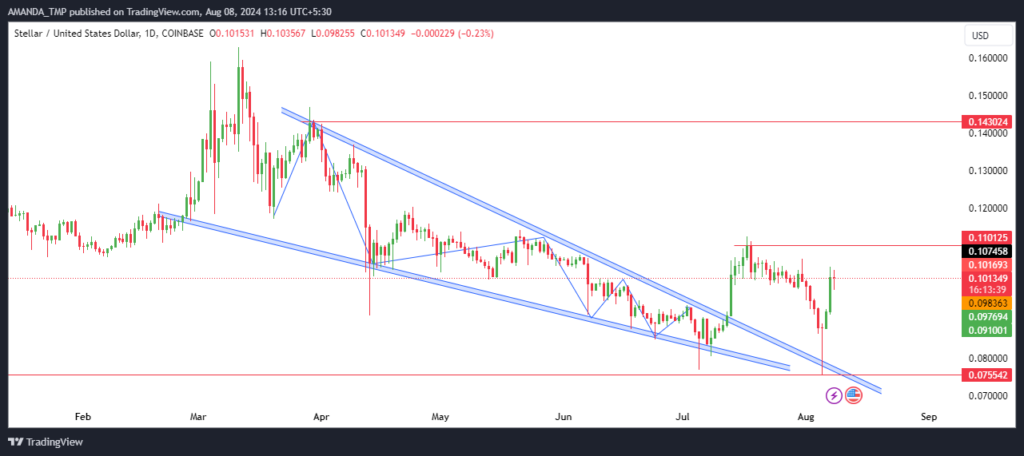
In mid-June 2023, XLM saw a dramatic surge, increasing by 150% in just one month. This sharp rise was followed by a period of consolidation, indicating accumulation.
Recently, XLM has shown renewed strength by breaking above the falling wedge pattern with strong momentum. This breakout suggests new highs may be on the horizon as bullish sentiment gains traction.
XLM Token Technical Indicators Overview
The 50-day and the 200-day EMAs are trading in a death cross. However, the price exhibited a repelling behavior as it broke out above the 20 and 50-day EMAs.
If the price continues to surge and crosses the 200-day EMA, we might see a golden cross in the future.
XLM/USD Chart by TradingView
The MACD and the signal line were trading in a death cross, and the following metrics declined to a negative trajectory. This exhibited weakness in the token price.
The RSI also advanced above the 50-level and gave a closing above the same. Also, the RSI broke out above the 14-day SMA and sustained above the same. It showed a rise in the bullish momentum of the price.
The support levels for the XLM token are $0.050 and $0.0750, followed by the resistance at $0.1070 and $0.1430.
Disclaimer
This article is for informational purposes only and does not provide any financial, investment, or other advice. The author or any people mentioned in this article are not responsible for any financial loss that may occur from investing in or trading. Please do your research before making any financial decisions.




