
 Wisp
Wisp Doge Pepe
 Crawlerpad
 Zylo Ecosystem
 Pearl
Pearl Basic Attention
 Quantus
- Render (RNDR) has a total of 23.98K holders, according to CoinCarp (press time).
- RNDR price has advanced by 170% in the last 1 year.
The Render token’s liquidity was slightly low with a volume/market cap ratio of 2.42%. The traded volume for the token declined by 4.04% in the last 24 hours from the press time.
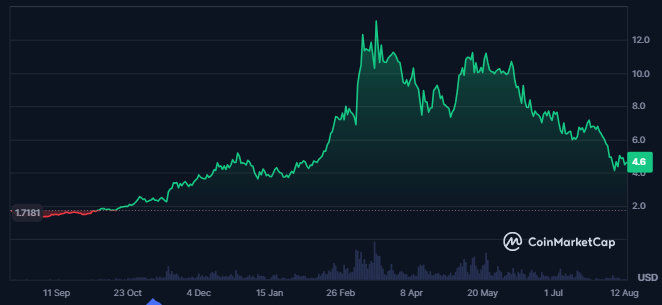
The Render token traded volume in the last 24 hours was worth $42.047 Million, followed by a market cap value of $1.813 Billion. Additionally, the Total Value Locked (TVL) for the token was worth $2.0 Million.
The circulating supply of the token was 392.459M RNDR and its total supply was 532.219M RNDR which was followed by a supply inflation of 6.18%. Its fully diluted market cap was $2.45 Billion and the token price advanced by 12400% from its all-time low.
The social dominance of Render token further showed strong social dominance followed by the surge in the number of X (formerly Twitter) followers. Additionally, the number of Reddit subscribers rose over time, followed by a surge in Telegram users.
Render Token Derivatives Data Analysis
The derivatives traded volume rose by 2.4% in the last 24 hours. Additionally, the value of the traded volume for the derivatives of the token was $52.54 Million.
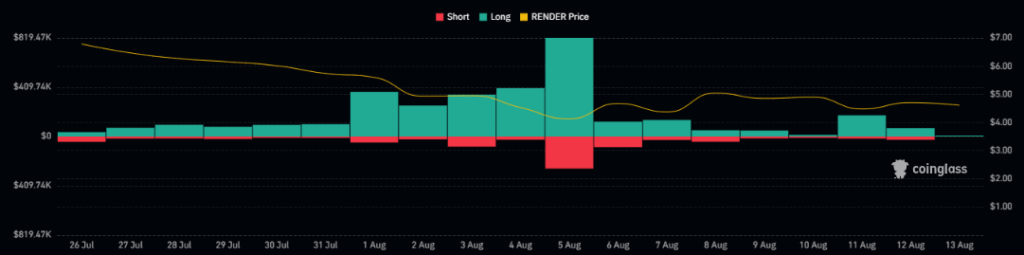
Despite the surge in the volume, the token’s open interest declined by 7.7% and the long/short ratio of the token was 0.9346.
The long liquidation worth $62.84K against the shorts of $14.08K in the last 24 hours reflected seller dominance.
RNDR Token Technical Analysis
RNDR experienced consistent profit-taking over the past five months, resulting in a pronounced decline in price.
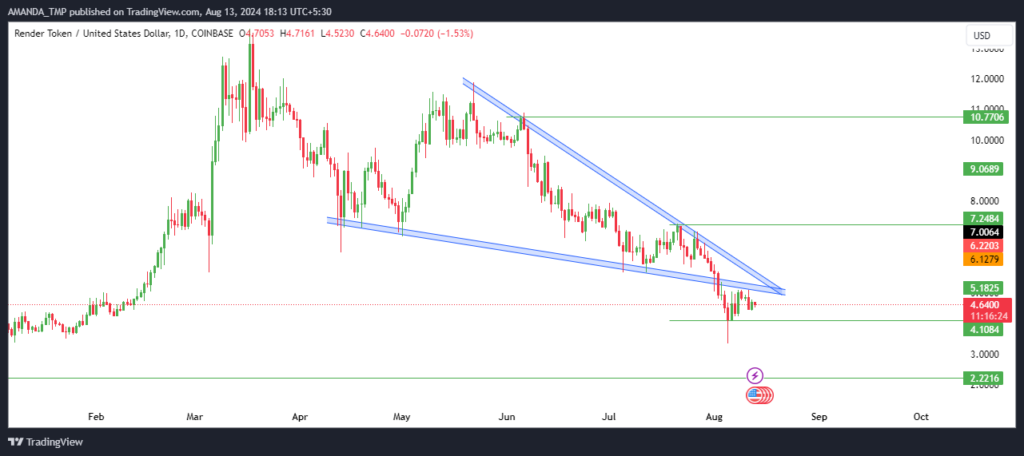
This persistent selling pressure has led to the formation of a descending triangle pattern, a bearish technical indicator often associated with potential further declines.
Since March 2024, RNDR has been under considerable downward pressure, with its price falling by 70% from a swing high of $13.62. This significant drop underscores the ongoing challenges faced by the token in maintaining its value amid market volatility.
Recent price movement highlighted the bearish trend, with the token breaking down from its previous levels. This breakdown suggests the token could reach lower levels shortly.
RNDR Token Technical Indicator Analysis
RNDR has been under sustained pressure, consistently trading below the 200-day EMA for the past 30 days.
This persistent decline was further exacerbated by the formation of a death cross on the daily chart. The 50-day EMA crossed below the 200-day EMA, signaling a strong bearish trend.
RNDR/USD Chart by TradingView
Additionally, the MACD and signal line have entered a death crossover, both trending negatively, which reinforces the bearish outlook. These technical indicators suggest a lack of bullish momentum and the potential for continued downward movement.
The RSI has also weakened, falling below the 50-level and the 14-day SMA, and has now entered the oversold zone. This decline reflects a bearish cycle in the price, indicating increased selling pressure and a lack of buying interest.
Support levels for RNDR are $2.20 and $4.00 and the resistance levels are $7.20 and $10.70.
Disclaimer
This article is for informational purposes only and does not provide any financial, investment, or other advice. The author or any people mentioned in this article are not responsible for any financial loss that may occur from investing in or trading. Please do your research before making any financial decisions.




