
 Minter
 Pearl
Pearl NEAR Protocol
 Pons
Pons Quack AI
 Quantus
 Sui
Sui
- The Starknet price has declined 75% in the past 2 months.
- STRK token’s price has been struggling below the 20-day EMA for the past few months.
The STRK price chart has witnessed a blood bath for the past few months and recorded an all-time low of $0.320 on August 05. It has been in a strong bearish trend and failed to overcome the 20-day EMA.
The digital asset price has fallen due to resistance from a descending trendline since March. Since March, the Starknet price has lost more than 85% and reached the bottom.
The bearish trend has halted near the $0.3500 hurdle and triggered a breakout from the trendline. The price has extended to the 20-day exponential moving average, expecting a breakout.
STRK Price Overview
When writing, Starknet crypto traded at $0.399 and dropped by 1.94% in the past 24 hours. STRK token’s market capitalization was $652.40 Million, and the 24-hour trading volume was $72.40 Million.
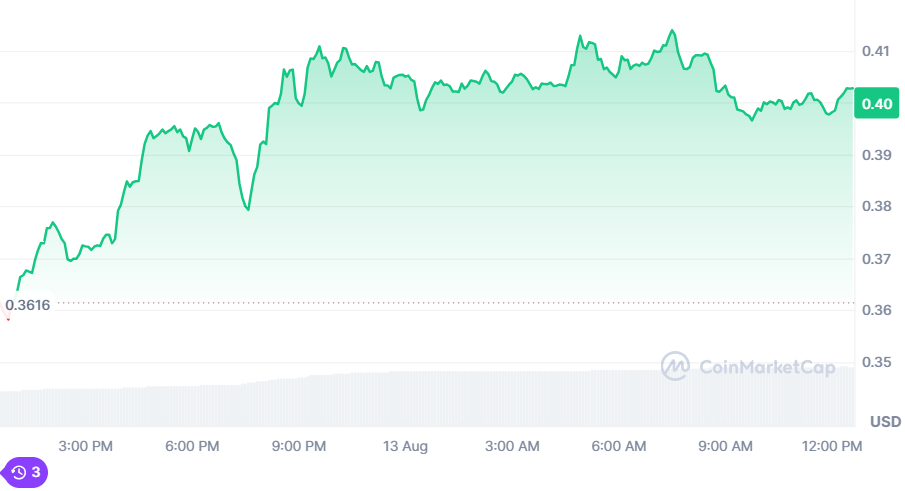
The circulating supply was 1,619,969,137 STRK, and the total supply was 10,000,000,000 STRK. Starknet crypto has diluted only 16.20% of its coins in the total market.
Is a Massive Gain of 200% Expected in STRK Crypto?
Based on a source on X, the STRK price has triggered a breakout from a trendline in a 4-H time frame. After the retest, the price is expected to hit the $0.650 territory in the next few weeks.
$STRK ~ send it #STRK #strk pic.twitter.com/z3IWAO2Nhl
— Kylo (@Kylo_XBT) August 12, 2024
STRK Price Triggered a Breakout; Is It Ready to Shoot Up Soon?
In April and May, the Starknet crypto price attempted multiple times to overcome the $1.40 hurdle but couldn’t. The sellers were strong and dragged down the price below the psychological level of $1.
The chart structure has displayed a breakout from the main trendline and reached the 20-day EMA.
If the digital asset price retests the trendline after the breakout, it may gain bullish momentum. Suppose the trading volume increases, it may boost the momentum for a massive upsurge.
Conversely, if the crypto asset price faces resistance from the 20-day EMA and slips below the trendline, it may turn into a fake breakout. After a fake breakout, sharp selling can be seen.
Based on the technical indicator, the RSI has triggered a golden crossover with the RSI-based moving averages. According to RSI, the STRK price seems to have found the bottom and is ready for reversal.
STRK Price Analysis
It seems that there is potential for a bullish move in the STRK crypto price. The breakout from the trendline and the potential retest could lead to a significant upward movement. It could possibly reach $0.650 in the coming weeks.
In conclusion, while there are indications of a potential 200% gain in the STRK crypto, it’s important to remain cautious. Moreover, observing the market closely for any signs of reversal or fake breakout is necessary.
Technical Levels
The Starknet price is expected to face resistance from the $0.620 and $0.750 levels. It may take support at the $0.350 and $0.310 mark.
Disclaimer
This article is for informational purposes only and provides no financial, investment, or other advice. The author or any people mentioned in this article are not responsible for any financial loss that may occur from investing in or trading. Please do your research before making any financial decisions.




