
 Bunker Mode
 Pearl
Pearl Wormhole
 Pons
Pons NEAR Protocol
 Starknet
 Quantus
MD— HTX price has witnessed buying pressure after a continuous fall. It has gained more than 70% in the last two weeks, indicating the buyers’ interest.
- The HTX crypto price has surged by 70% in the past 2 weeks.
- HTX crypto has diluted 100% of its total supply of coins in the open market.
The technical chart showed the momentum has shifted to the buyers’ side in the HTX crypto. The HTX price has been falling through a descending channel since March.
However, in the first week of August, the price took support on the lower trendline and triggered a breakout from the channel.
After the breakout, the price performed extraordinarily and has recovered the recent losses. At the time of the breakout, the price had retested the upper trendline in the short term. It displayed a directional move.
HTX Price Overview
At press time, the HTX crypto was being traded at $0.00000143, which has gained 1.31% in the past 24 hours. The market capitalization was $1.41 Billion, and the 24-hour trading volume was $60.59 Million at the time of writing.
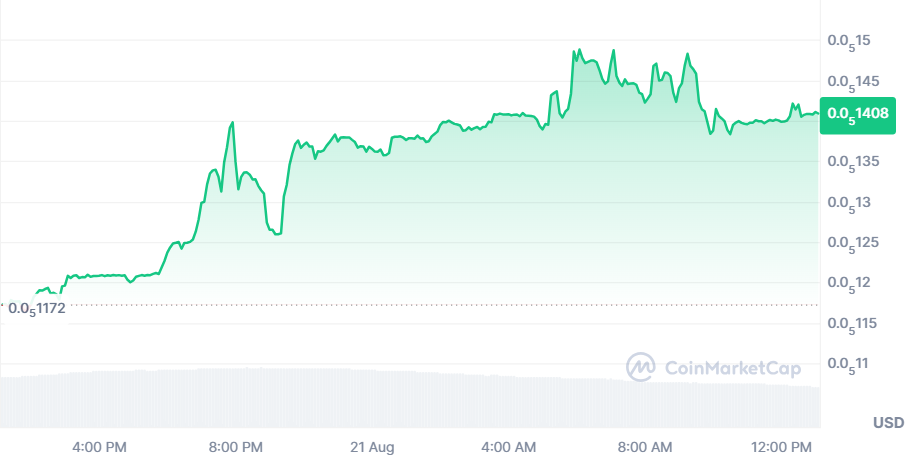
The circulating and total supply has been 999.99T HTX, and the fully diluted market cap is $1.41 Billion.
Performance
HTX price has surged by 56.19% in a week and 33.02% in a month. However, the price has declined by 21.65% in the past 6 months but has remained positive yearly.
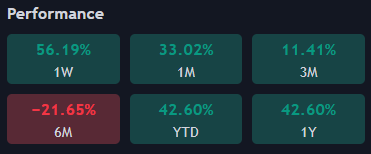
HTX Crypto Price Performance
A source on X claimed that the HTX has rewarded 50% in a few days. As of August 20, the HTX crypto was up by 15%; since August, the price has gained around 50%.
Congrats Trade to Earn Participants!
— HTX (@HTX_Global) August 20, 2024
Your $HTX rewards just jumped 50%!
As of August 20, HTX is up 15% in 24HRS and 50% since August 5th!
Trade $BTC, ETH, and TON with zero fees and share in our daily 340,000 USDT prize pool!
Join >> https://t.co/cMUIl32Is7 pic.twitter.com/mfwMQrAcsp
This massive change has flipped the trend to bullish, and buyers have accumulated and are riding the trend.
Are Buyers Strong Enough to Lift the HTX Crypto Price Further?
According to the technical chart, the HTX crypto price has shown bullishness after the breakout. It has surpassed the 20-day EMA and has formed a big marubozu candlestick.
Investors might be attracted if the buyers remain strong and the trading volume increases. The involvement of investors may leave a positive impact on the price, and bullish momentum for the long term can be anticipated.
On the other hand, selling can be seen if the digital asset price faces resistance from the $0.00000150 hurdle. Suppose the HTX price slips below the $0.00000140 mark. Most sellers may prefer to book profit, which may lead to strong selling pressure.
Based on the technical indicators, the MACD has generated a golden crossover. The histograms are strong and have flipped to green. RSI is 80, which has rapidly recovered from the oversold zone and has extended to the overbought zone.
Is HTX Price in Buyers’ Grip?
The HTX crypto has experienced a significant surge in price over the past few weeks, indicating a shift in momentum on the buyers’ side. The technical indicators suggest bullishness, with the potential for further price increases if the buyers remain strong and the trading volume continues to rise.
However, it’s essential to monitor potential resistance levels, as a downturn in price could lead to increased selling pressure. Overall, the current technical indicators point towards a positive outlook for the HTX crypto.
Technical Levels
The HTX crypto price is expected to face resistance from the $0.00000160 and $0.00000200 levels. It may take support at $0.00000130 and $0.00000100 mark.
Disclaimer
This article is for informational purposes only and provides no financial, investment, or other advice. The author or any people mentioned in this article are not responsible for any financial loss that may occur from investing in or trading. Please do your research before making any financial decisions.




