
 Pearl
Pearl Ondo
Ondo Ethereum
 Bitway
 Derive
 Pudgy Penguins
 NEAR Protocol
- The OP token price broke above significant levels and is consolidating now.
- Optimism token has less than 28% of its total supply in circulation.
The Optimism (OP) price has experienced notable fluctuations over the past year with its relatively underwhelming performance. Despite a modest 11% gain, the token’s high volatility and a 75% price decline have raised concerns. This analysis explores the token’s recent price action and technical indicators.
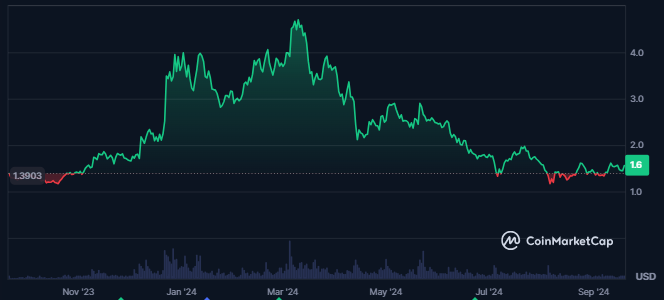
Over the past year, Optimism price underperformed against 69% of the top 100 cryptocurrencies. The token posted a modest gain of 11% during the period, reflecting a largely flat price trajectory.
The token exhibited high volatility, with a volatility rate of 5.23%. At the time of writing, OP’s market cap dominance was 0.09% and it is ranked #45 in the global cryptocurrency market.
Optimism’s market capitalization reached $1.855 Billion, while its trading volume saw a 9% increase in the last 24 hours, reaching $136.65 Million. This traded volume represents 7.32% of the token’s market cap, indicating medium liquidity within the market.
The token’s supply inflation was extremely high (453.02%), followed by a circulating supply of 1.187B OP, which was just 27% of the token’s total supply.
Optimism Witnessed Huge Long Liquidations in Just 24 Hours
The derivatives trading volume of Optimism crypto saw a notable 19% increase over the past 24 hours, bringing the total traded value to $199.07 Million. This figure significantly surpassed the spot trading volume, reflecting growing activity in the derivatives market.
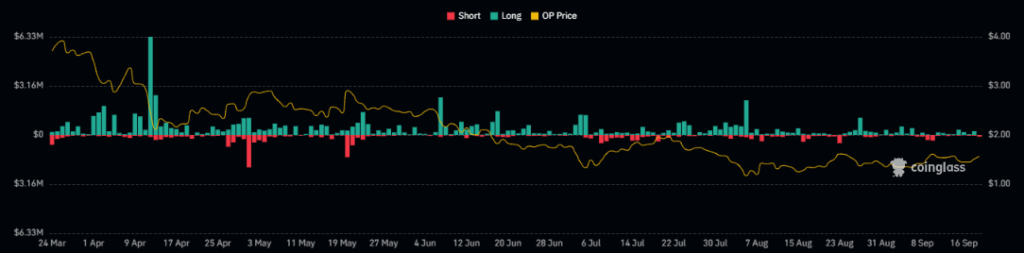
In tandem with this surge in derivatives volume, open interest also advanced by 5.07% during the same period, indicating a rise in open positions. Despite this, the market saw higher long liquidations, with $208.55K worth of long positions being liquidated, compared to $152.81K in short positions.
This liquidation disparity points to the dominance of sellers in the market, as a greater number of long positions were liquidated, putting downward pressure on the token’s price.
Reversal Signal isn’t Convincing
Over the past five months, the price of the OP token has dropped a sharp 75% from the high of $4.86 to $1.50. This extended downward movement was in the form of consistent lower lows on the daily chart, reflecting ongoing bearish pressure.
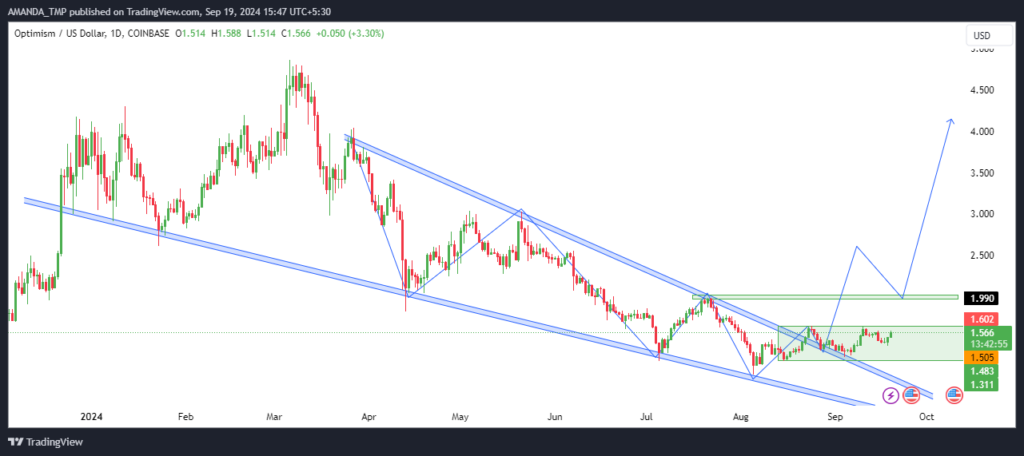
The sustained decline in OP’s price led to the emergence of a falling wedge pattern, which often indicates a potential trend reversal. Recently, the token managed to break above this wedge pattern, signaling a possible shift in momentum.
However, despite the breakout, the price action lacks support from the trading volume, making the upward movement less convincing.
A key level to watch is $2.00, which represents a significant change of character in the token’s price action. Should the OP token break above this level and sustain its position, it could pave the way for a further rally in the coming sessions.
Optimism Token’s Technicals Continue to Suggest Bearish Bias
The OP coin price broke above the 20 and 50-day EMAs but sustained below the 200-day EMA. This exhibited an uncertain to bearish price behavior in the token.
OP/USD Chart by TradingView.com
The MACD and the signal line advanced to the bullish trajectory. The metrics further traded in a golden cross, showing bullishness in price.
The RSI also sustained above the 50-level and advanced above the 14-day SMA. The RSI further traded at the level of 57.3 at press time exhibiting rising bullish momentum.
If the OP token price slips to lower levels, it might take support at the levels of $1.0 and $1.40 followed by the resistance levels of $3.0 and $4.0.
Disclaimer
This article is for informational purposes only and does not provide any financial, investment, or other advice. The author or any people mentioned in this article are not responsible for any financial loss that may occur from investing in or trading. Please do your research before making any financial decisions.




