
 Identity.md 6900
 Bunker Mode
 Crawlerpad
 Claudia
 Quantus
 Starknet
 Bitcoin
- The Litecoin price volatility was medium, reflecting stability in price.
- The LTC crypto price traded 5900% above its all-time low price.
Litecoin (LTC) has recently seen a significant increase in trading activity, with volume surging by 41% in the past 24 hours.
This rise in trader participation highlights renewed interest in the cryptocurrency, driven by strong liquidity, neutral investor sentiment, and steady market performance. Our analysis suggests new highs could be marked soon.
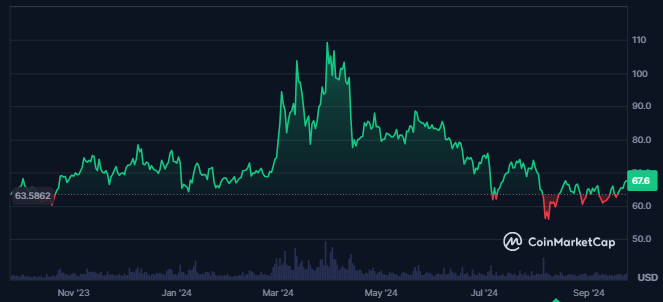
Litecoin has experienced a notable surge in trading activity, with its volume advancing by 41% in the past 24 hours. This significant increase in trader participation may be attributed to heightened activity within the crypto community.
At press time, Litecoin ranked 24th in terms of traded volume, with a total value of $318.872 Million. Its volume-to-market cap ratio stands at an impressive 6.30%, indicating strong liquidity in the market.
The market capitalization of Litecoin has remained relatively flat over the past day, showing a modest gain of 0.33%. Despite this, the cryptocurrency maintains medium volatility, registering at 2.73%.
Investor sentiment appears neutral, as reflected by the Fear and Greed Index. Litecoin’s supply inflation remains supportive at 1.76%, contributing to its overall market stability.
At the time of writing, 75 million LTC tokens were in circulation, representing 89.29% of the maximum supply. The fully diluted market capitalization for Litecoin stands at $5.676 Billion.
Despite market fluctuations, Litecoin holds a strong presence in the crypto space, ranking as the 20th largest cryptocurrency with a market cap dominance of 0.23%.
Activity in Litecoin’s Derivatives Surges in the Last 24 Hours
The liquidation chart for Litecoin shows a higher volume of long liquidations, indicating that bearish sentiment has dominated the market.
In the past 24 hours, long positions worth $427.76K were liquidated, significantly outpacing short liquidations, which amounted to $365.83K.
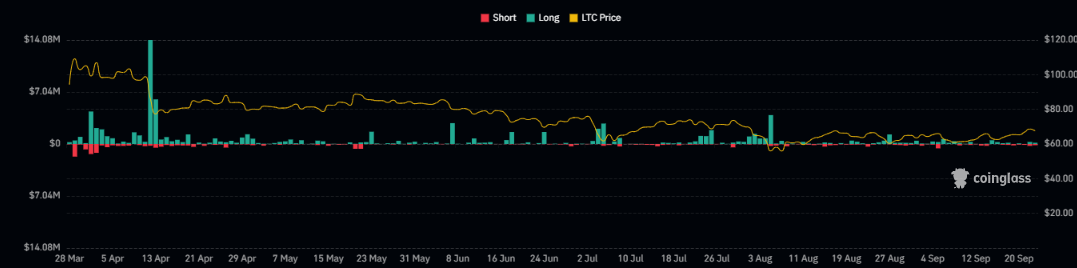
This trend reflects the increasing influence of sellers over Litecoin’s price movements. Additionally, both derivatives and spot trading volumes have surged by 70% within the same period, leading to a total traded value of $300.47 Million. The open interest in Litecoin derivatives also saw a 3.2% increase, suggesting a growing number of open positions in the market.
Where is the Litecoin Price Heading To?
Following a consistent decline followed by the profit booking from the swing high of $112.98, the coin lost its value by 55% in six months.
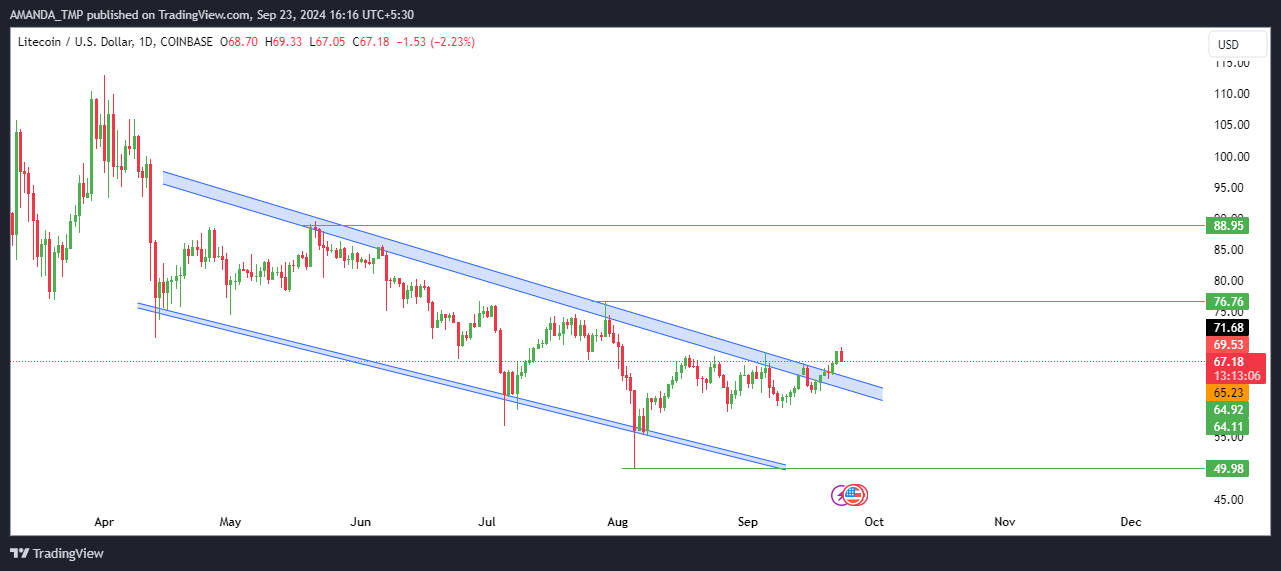
The following bearish behavior of the price led to the formation of a falling wedge pattern on the daily chart.
The most recent price action in the Litecoin crypto further showed a breakout in the token price. If the token price sustains above the breakout levels and gains volume, the price might continue to advance to higher levels.
What the Technicals are Indicating
The 20-day and the 50-day EMAs on the daily chart traded in a death cross. Against this, the LTC price broke above both the EMAs and sustained above the same. Despite this, the price still traded below the 200-day EMA showing weakness in overall trend.
LTC/USD Chart by TradingView
The MACD metrics advanced to the bullish trajectory. Following this, the MACD and the signal line traded in a golden cross which showed the dominance of buyers in price.
The RSI traded at a level of 57.2 at press time and sustained above the 50 level. The price further traded above the 14-day SMA showing a rise in the token’s bullish momentum.
The Litecoin crypto price might further take support at the level of $50.0 and $60.0 followed by the resistances of $76.0 and $89.0.
Disclaimer
This article is for informational purposes only and does not provide any financial, investment, or other advice. The author or any people mentioned in this article are not responsible for any financial loss that may occur from investing in or trading. Please do your research before making any financial decisions.




