
 Altai the Tiger
 Sword Inu
 streamoors
 IGNITION
 NEAR Protocol
 Pearl
Pearl Injective
- The GALA token price was outperformed by 54% of the top 100 crypto assets in the last 1 year.
- The annual inflation rate of the token was very high, resulting in 42.6%.
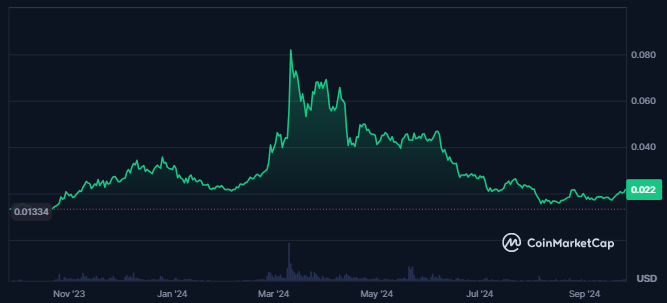
Gala (GALA), a prominent cryptocurrency, has experienced significant volatility. This volatility reflected both market opportunities and challenges.
While recent spikes in investor sentiment and trading volumes signaled positive growth, the GALA price has substantially declined. This has raised questions about its next move: will the GALA price revert to its highs or dip further?
GALA Price Market Performance
The GALA crypto held a market cap dominance of 0.03%, equating to a total market cap value of $755.723 Million. Over the past 24 hours, the market cap has grown 1.8%. According to CoinMarketCap, the token has secured the 86th rank by market capitalization.
Investor sentiment around the cryptocurrency appeared positive, with the Fear and Greed Index scoring 59. This indicated a state of greed. The sentiment was bullish, though the crypto’s volatility remains high, recorded at 5.77%. This suggested a potential for sharp movements in the GALA price.
In terms of trading activity, the crypto’s volume has surged by 44% in the last 24 hours. This brought the total traded value to $111.905 Million.
The volume-to-market cap ratio stood at an impressive 15.05%. It highlighted the significant trading activity and market engagement surrounding the asset.
At press time, only 7% of the token’s holders were in profit, while 91% witnessed loss. Additionally, the total number of holders in the token amounted to 223.4K.
Analysis of GALA Crypto’s Derivatives Market Activity
The derivatives trading volume for GALA crypto has seen a notable increase of 26% in the past 24 hours. It brought the total traded value to $246.24 million. This surge in trading volume indicated heightened market activity and interest in GALA’s derivatives market.
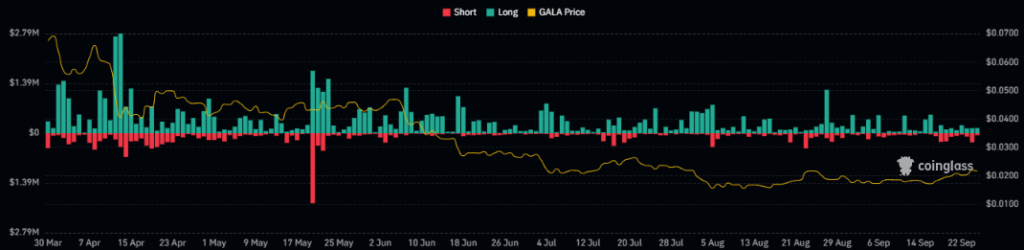
However, open interest in GALA has declined by 1.97%, resulting in a total value of $67.35 Million. This decrease suggested that some traders have been closing their positions, potentially due to uncertainty in market direction.
GALA’s long/short ratio stood at 0.9685, reflecting a slight tilt toward short positions. Long liquidations amounted to $241.62K, while short liquidations totaled $203.1K.
These figures highlighted the recent sellers’ dominance in the market. This happened as selling pressure outweighed buying interest, influencing the GALA price movements.
Let’s Break Down the Technical Chart of the GALA Price
The GALA price has experienced significant volatility, leading to a sharp decline in value. This downward trend highlighted the continued sellers’ dominance in the market, driving the token price lower.
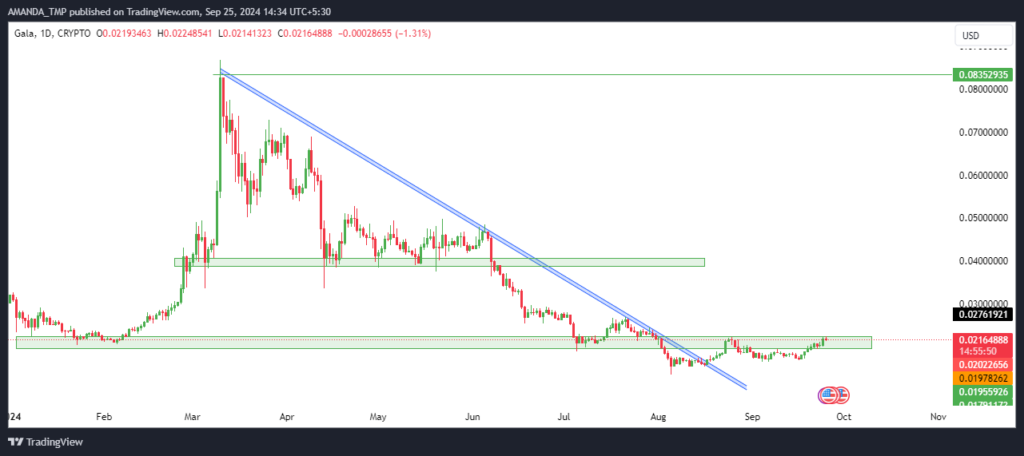
A closer price chart analysis revealed that GALA crypto traded below a crucial resistance level. Additionally, the trading volume has been weak, as indicated by the formation of small candlesticks. It suggested limited market participation during recent trading sessions.
Over time, the GALA price has dropped to a critical support zone, losing more than 95% from its all-time high of $0.8367. This steep decline underscored the cryptocurrency’s challenges in maintaining value amid broader market pressures.
Disclaimer
This article is for informational purposes only and does not provide any financial, investment, or other advice. The author or any people mentioned in this article are not responsible for any financial loss that may occur from investing in or trading. Please do your research before making any financial decisions.




