astronaut
 Zylo Ecosystem
 Pearl
Pearl Bitcoin
 Quantus
 Pudgy Penguins
 Bitway
- The 24-hour trading volume has surged by 120%.
- The Core price has defended the major support level of $0.85.
- CORE price has exceeded the 20-day exponential moving average and is eyeing a 200-day EMA.
Core (CORE) price price has witnessed a massive spike of more than 600% in the last week of March. Furthermore, the CORE price has displayed a slow and steady fall after this spike, demonstrating profit booking. The price has declined by forming lower lows and lower highs on a daily timeframe.
Core crypto price has formed a strong base near the $0.85 level. Despite this, sellers attempted to drag it down multiple times but couldn’t. The price has formed a descending triangle pattern and reached a crucial breakout level. Let’s see how it will react after the breakout.
CORE Price Shaped a Descending Triangle; Could It Soar After Breakout?
When writing, the Core crypto was trading at $0.985 by losing 3.85% over the past 24 hours. The market capitalization was $900.34 Million, and the 24-hour trading volume was $58.10 Million.
As per the chart structure, the CORE price was wandering near the breakout territory. The trading volume has increased by 120%. This could trigger a bullish spark after the breakout.
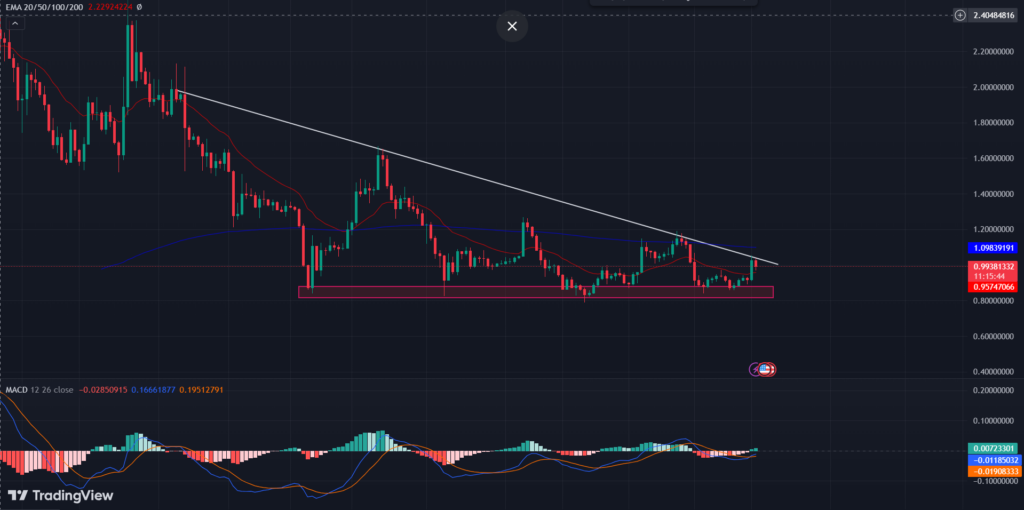
If the CORE price gets extra pushup by bulls, it could trigger a breakout from the triangle pattern. Once the price sustains over the 200-day EMA, it could generate a buying opportunity. The trading volume has provided a positive buildup, which could help the price to make it big.
On the other hand, suppose the digital asset price faces resistance from the 200-day EMA. It may fall back to the significant support level of $0.85. Assuming the CORE price loses this level, sellers may drag the price to the previous support level of $0.50.
Turning to the technical indicators, the MACD has generated a bullish crossover with the Signal line and is wandering in the positive territory. The histograms have turned green, which could attract buyers. RSI has displayed bullish divergence and a golden crossover
Can CORE Price Generate Pullback Scenario?
Pius Paul (@Piuspaul_space) has suggested a long position in Core Crypto. It has the potential to shoot up, as per the technical chart.
It could be wise to go with 10x leverage with proper risk management. The price may witness a pullback and has the potential to lift the price by 70%.
CORE Price Prediction Based on Technical Chart
Based on the analysis, the CORE price is currently at a crucial point. There is a possibility of a bullish breakout from the descending triangle pattern.
The increased trading volume and the potential for a breakout could lead to a positive price movement. If the price sustains above the 200-day EMA, it could present a buying opportunity.
However, it’s essential to see the resistance from the 200-day EMA. Failure to surpass this level could lead to a retraction towards the major support level of $0.85.
Additionally, the technical indicators, such as the MACD and RSI, show bullish signals, which may attract buyers. Monitoring the price action and key levels for potential trading opportunities is important.
Disclaimer
This article is for informational purposes only and does not provide any financial, investment, or other advice. The author or any people mentioned in this article are not responsible for any financial loss that may occur from investing in or trading. Please do your research before making any financial decisions.