
 Quack AI
 Pearl
Pearl Solana
 NEAR Protocol
 Canton
 XRP
XRP Derive
- Ethereum price is in a pullback zone, and another rally is anticipated.
- The ETH price needs to gain 36% to reach ATH at press time.
Ethereum (ETH) crypto has departed from a parallel channel and has displayed a bullish rally. The bullish momentum has halted near the resistance level of $3,350 and shown mild weakness. Moreover, the Ethereum price has defended the 20-day EMA in the retreat zone.
Since November 15, the ETH crypto price has displayed mild buying. This could be an advantage for a pullback. The price needs to surpass the recent high for a bullish rally. Let’s explore what happens next.
Ethereum’s Resilience Amid Price Surge
Despite the rise in the price of Ethereum, retail investors have held onto their holdings. It is a sign that they believe in its potential future value.
There was a general reluctance to sell despite the price increase. This was evidenced by a trend of low exchange inflows and a Spent Output Profit Ratio (SOPR) close to breakeven.
Moreover, the investors had a solid “buy and hold” approach. It fueled conjectures that Ethereum might rise to $4,000 if it held a support level above $2,800.
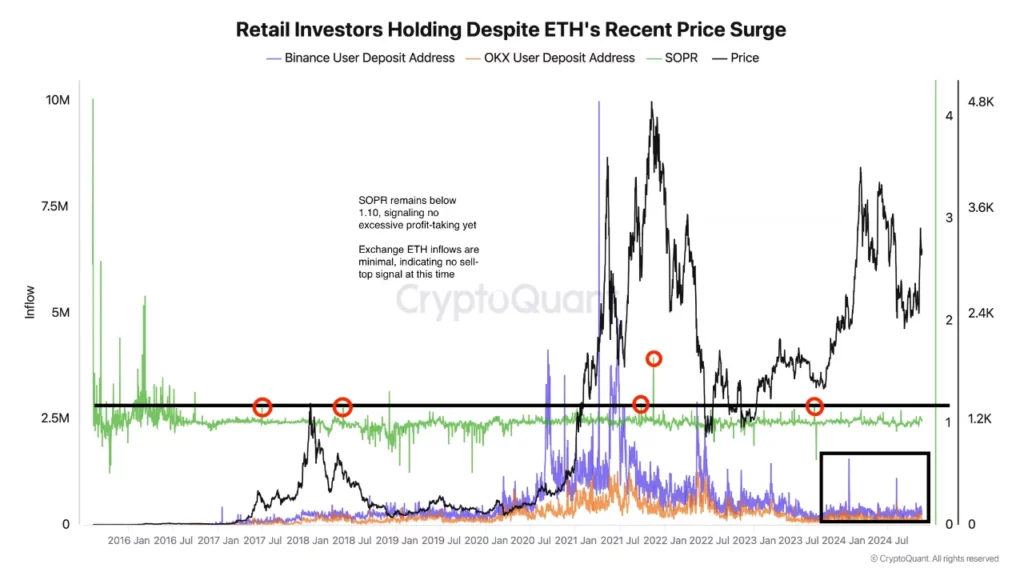
Persistent retail investment and overall market mood might drive Ethereum to a new all-time high. Moreover, a 54% rally could be seen from the current price levels.
Could ETH Price Record a New ATH?
At press time, the Ethereum price was trading at $3,123. It has remained neutral over the past 24 hours. The market capitalization was $376 Billion, and the 24-hour trading volume was $27.80 Billion.
After a rally, the ETH price has undergone a pullback territory. Moreover, the buyers seem strong as per the technical chart.
A buying opportunity could be generated if the crypto price surpasses the recent high. Exceeding this zone could trigger buying momentum, and the price may extend to a new all-time high.
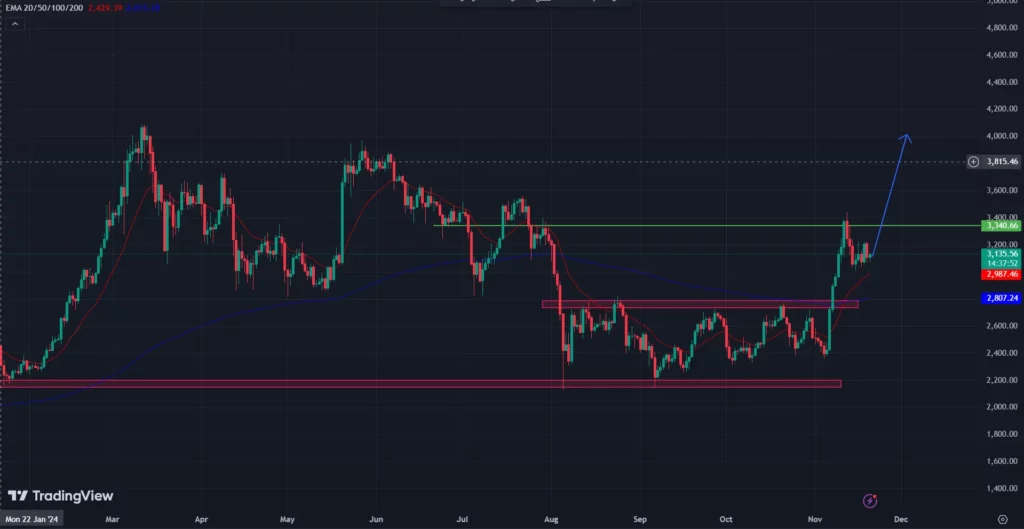
Conversely, if the ETH crypto price slips below the 20-day EMA, sellers may drag down the price to the 200-day EMA.
Most investors would prefer to book a profit once the price starts trading below the 200-day EMA. Here, profit booking could lead to strong selling pressure, and a bearish trend can be seen.
The chart’s Relative Strength Index (RSI) and other technical indicators were positioned within a range. It has historically corresponded with bullish momentum.
The RSI indicated that there was potential for growth without the immediate threat of a downward correction. That’s because it was still below the overbought area.
Ethereum Price Dynamics & Future Potential
The Ethereum price experienced a pullback after a bullish rally. There is a critical need to break through the resistance at $3,350 to pave the way for a new all-time high.
Retail investors have demonstrated strong confidence in the asset by holding onto their positions. This indicates a belief in its long-term value.
If Ethereum can maintain support above $2,800 and successfully clear recent highs, there is potential for substantial gains. The token could reach $4,000. Conversely, suppose the price falls below the 20-day EMA; selling pressure may increase, leading to a downturn.
Disclaimer
This article is for informational purposes only and provides no financial, investment, or other advice. The author or any people mentioned in this article are not responsible for any financial loss that may occur from investing in or trading. Please do your research before making any financial decisions.




