
 Quack AI
 Pearl
Pearl Solana
 NEAR Protocol
 Canton
 XRP
XRP Derive
- Pepe price has lost 13.27% in less than two days.
- PEPE coin price was forming a bearish candlestick pattern.
Pepe price has undergone a consolidation phase since mid-November post a bullish rally. In December, the PEPE coin price tried to continue the bullish trend but sellers were strong enough. The price failed to reach the last swing high and displayed a decent fall. Amid this fall, the price has slipped below the 20-day EMA and is heading toward the 200-day EMA.
On the daily time frame, the price had generated a bearish signal and was set to witness a decent fall. The recent decline might invite sellers which may lead to a bearish rally. This pullback is probably going to be caused by the bearishness in the cryptocurrency markets as well as the growing whale activity. Despite the ongoing trading activity, the token is consolidating following a huge rally in late 2024.
Whales Started Taking Profit: Time For a Bearish Move?
A whale recently deposited 217 billion PEPE ($4.496 Million) to the Kraken exchange, according to Spot On Chain data. This strategy produced a $767K (+20%) profit in just 17 days. Even so, one whale still holds $25.1 Million worth of 1.21 trillion PEPE tokens, with $4.05 Million in unrealized gains spread across two wallets.
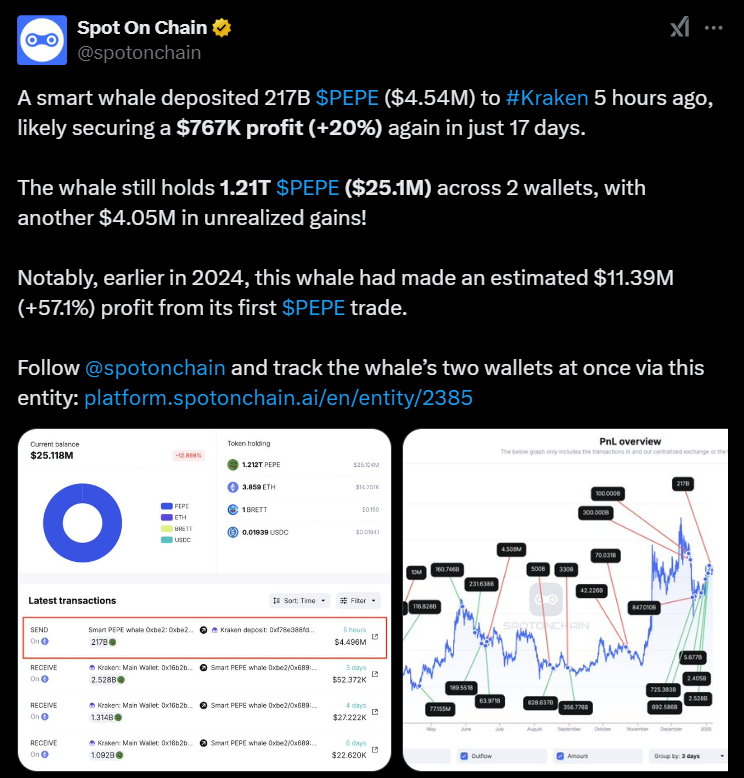
Additionally, this whale’s first significant PEPE trade earlier in 2024 generated a profit of $11.39 Million (+57.1%). These kinds of whale movements increase market liquidity but also increase volatility, especially when they occur in significant quantities.
PEPE’s price has been under downward pressure due to the increased selling activity, but the overall state of the market is still negative.
PEPE Price Has Shaped a Head & Shoulder Pattern
Pepe crypto was trading at $0.0000178 at the time of writing which has dipped by 3.56% over the past 24 hours. The market capitalization was $7.59 Billion and the 24-hour trading volume was $1.94 Billion.
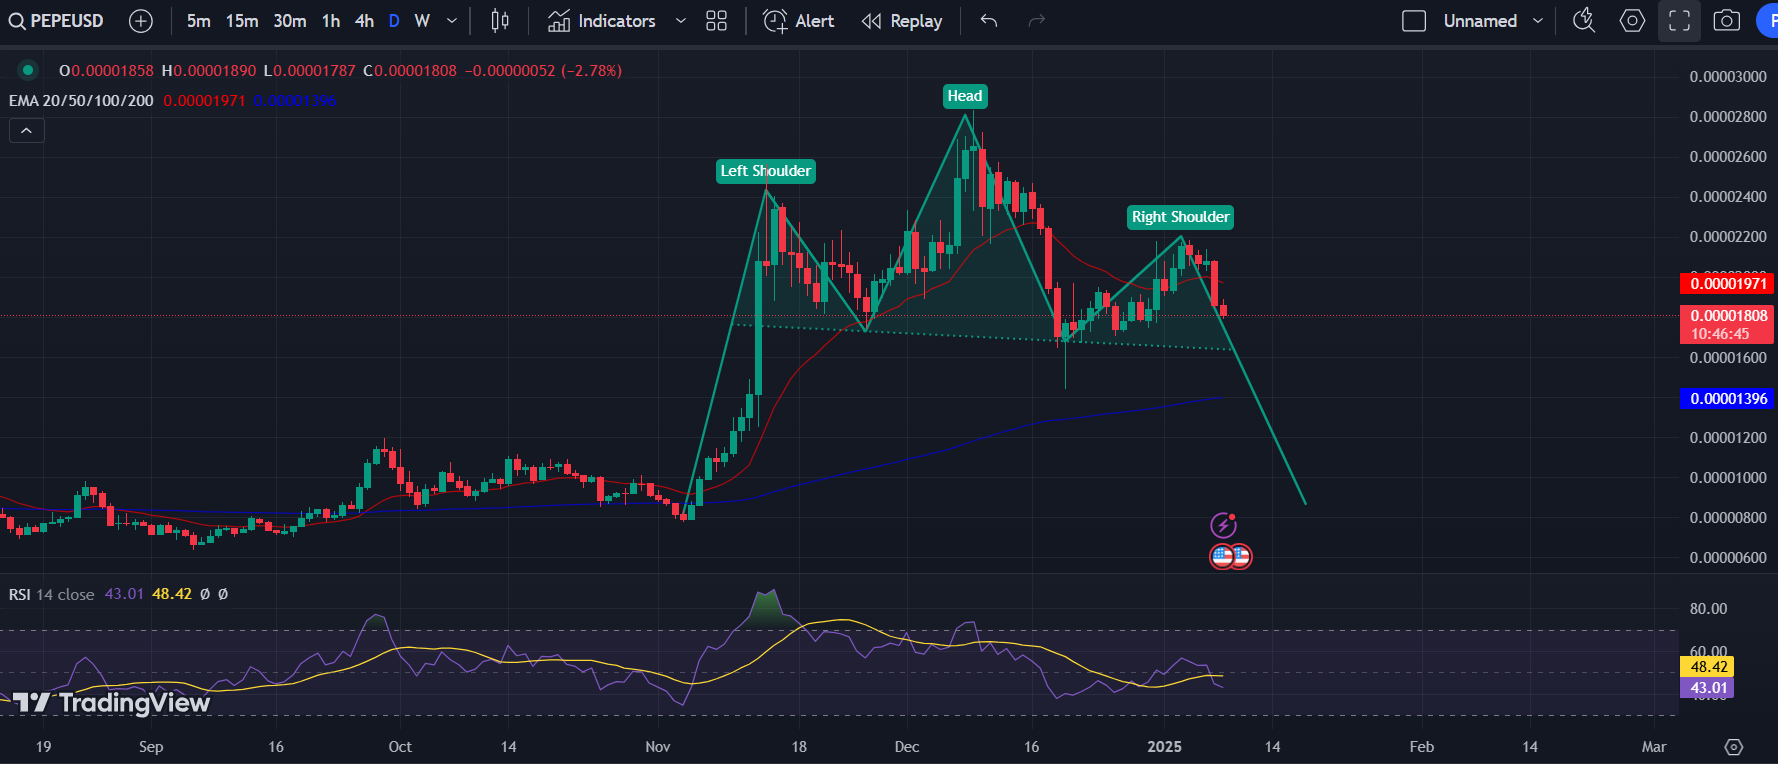
PEPE crypto price has formed a head and shoulder pattern on a daily time frame and has dropped to the neckline ($0.0000180). The price was trading in the neckline territory. Once the price loses this zone, it might form a right shoulder which indicates the bearish trend.
Conversely, if the price bounces back from the neckline territory, buyers might show interest. If PEPE price exceeds the 20-day EMA and holds, buying momentum can be anticipated.
RSI has triggered a bearish crossover with the RSI-based moving average which showcases the bearish forecast.
PEPE Price Analysis Amid Whale Activity
The recent performance of the PEPE coin indicates a concerning bearish trend following a significant price decline of 13.27% in a short period. The formation of a bearish candlestick pattern and the move below critical support levels. Such as the 20-day and potentially the 200-day EMA, suggest that further downward movement may be on the horizon.
The head and shoulder pattern formed on the daily timeframe reinforces the bearish outlook, particularly if the price fails to hold at the neckline. However, there remains a glimmer of hope. If the price can rebound from this level and surpass the 20-day EMA, it may attract buying interest, potentially reversing the bearish momentum.
Disclaimer
This article is for informational purposes only and provides no financial, investment, or other advice. The author or any people mentioned in this article are not responsible for any financial loss that may occur from investing in or trading. Please do your research before making any financial decisions.




