Dacity Coin
 Celestia
 Pudgy Penguins
 Injective
 Solana
 Sui
Sui Starknet
- Peter Brandt highlighted a bearish pattern of heads and shoulders on Bitcoin‘s daily chart.
- Analysts have cautioned that breaching $92,000 support may accelerate the decline.
Bitcoin price faced a turnaround and dropped below the $95000 mark. This erased over 7% of its value within the last 48 hours.
Since November, the price of Bitcoin has surged more than 500% and reached the peak of the current bullish cycle. Per the current trend, the BTC price could experience a decline. Moreover, the token may retest the $88000 support level in the coming days.
According to renowned financial analyst Peter Brandt, a bearish head and shoulders pattern was visible on the BTC price chart. If the pattern is confirmed, the Bitcoin price could decline severely and drop to $73000 soon.
Bitcoin was trading at $93600 at press time, noting a decline of over 2.30% in the last 24 hours. Its market cap has fallen to $1.84 Trillion.
Bitcoin Price at Risk? Brandt Notes Head and Shoulders Pattern
Peter Brandt posted a tweet on X while signaling a caution. He speculated about the formation of the head and shoulders pattern on the Bitcoin chart. However, the pattern has not been wholly ornamented, and its completion could lead to massive price decline.

“The daily chart is tracing out a head-and-shoulders top. This pattern might take prices to $73,000, or it might morph into something else,” he said.
Moreover, crypto analyst Ali Martinez shared similar opinions. He mentioned that the Bitcoin price has dipped below a significant barrier of $95,400 to $98,400.

Per him, this zone was an active one earlier, at which around 1.77 million addresses purchased 1.53 million BTC. The disintegration of this level has created additional downside risk to the coin.
Martinez added that once the price of Bitcoin falls to $91,200, the level could act as vital support. Furthermore, a break below could pave the way to $74000.
Data from Alphractal revealed that BTC’s short-term holders (STH) tend to liquidate their holdings rather than accumulate. Also, the waning investor confidence aligned with the decline in the accumulation trend.
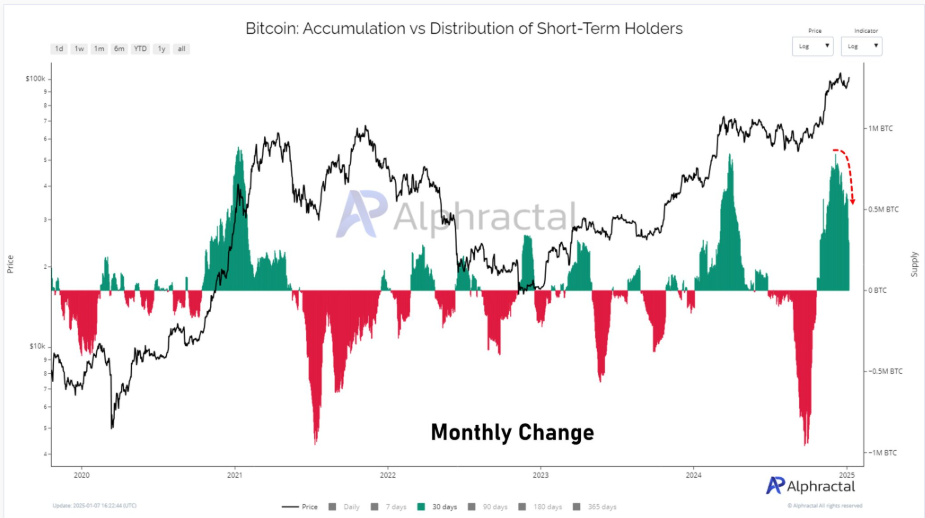
Over the past seven days, BTC daily active addresses have noted a significant drop of over 2.20% to 955,682. This replicated declining investor confidence amidst the recent price decline.
Bitcoin Price Analysis: What to Expect Next?
The daily chart analysis shows that the Bitcoin price has declined by over 8% in the past three days. The token dropped below the 50-day EMA mark, suggesting increasing selling pressure.
However, it was edging closer to the crucial support zone of $91,000, which could decide the next move. A rebound could be seen if the Bitcoin price succeeds in holding the decline around $91k.
A decline below the mark could intensify the ongoing selling pressure. Furthermore, it could open the doors toward $78,000 for the short term.
Data from Coinglass indicated that aggressive shorts had been added on significant exchanges. On Binance, long contracts have declined to 47%, while shorts have surged to 53%. This implied a bearish outlook.
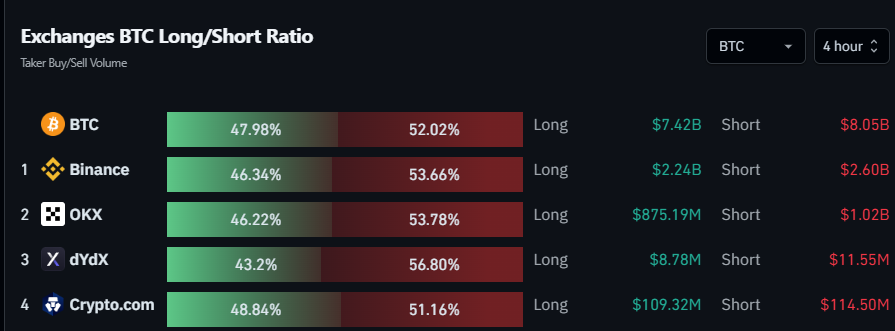
The immediate support of $91,000 was a make-or-break level for BTC. At the same time, a cross above $96,000 could resume the upward rally and negate the bearish pressure.
Disclaimer
This article is for informational purposes only and provides no financial, investment, or other advice. The author or any people mentioned in this article are not responsible for any financial loss that may occur from investing in or trading. Please do your research before making any financial decisions.