Minter
 Pearl
Pearl NEAR Protocol
 Pons
Pons Quack AI
 Quantus
 Sui
Sui

Key Insights:
- Analysts identify key breakout levels as Shiba Inu nears resistance trendline.
- SHIB long-term holders rise as short-term traders decline sharply.
- Wedge pattern and moving average retest point to potential upside.
Shiba Inu (SHIB) experienced moderate volatility over the past seven days, with price action reflecting a mid-week spike followed by a gradual decline. Although the asset slipped into a sideways range from May 24 to May 26, it closed the week with a 4.32% gain.
At the time of writing, SHIB trades at $0.00001428, marking a 2.22% increase over the previous 24 hours.
Despite the recent pullback, multiple analysts have issued technical breakdowns highlighting critical resistance zones and potential breakout strategies based on price structure and long-term trend behavior.
Technical Structure Shows Breakout Potential for Shiba Inu
Recent analysis from TradingView contributor MBM_Crypto identifies $0.0000185 as a key resistance level for SHIB. This threshold aligns with a long-standing descending trendline that has capped upward price movements since March 5, 2024.
The trendline formed after SHIB peaked near $0.000045 and began retracing, eventually reaching $0.00001086 by August 5 of the same year.
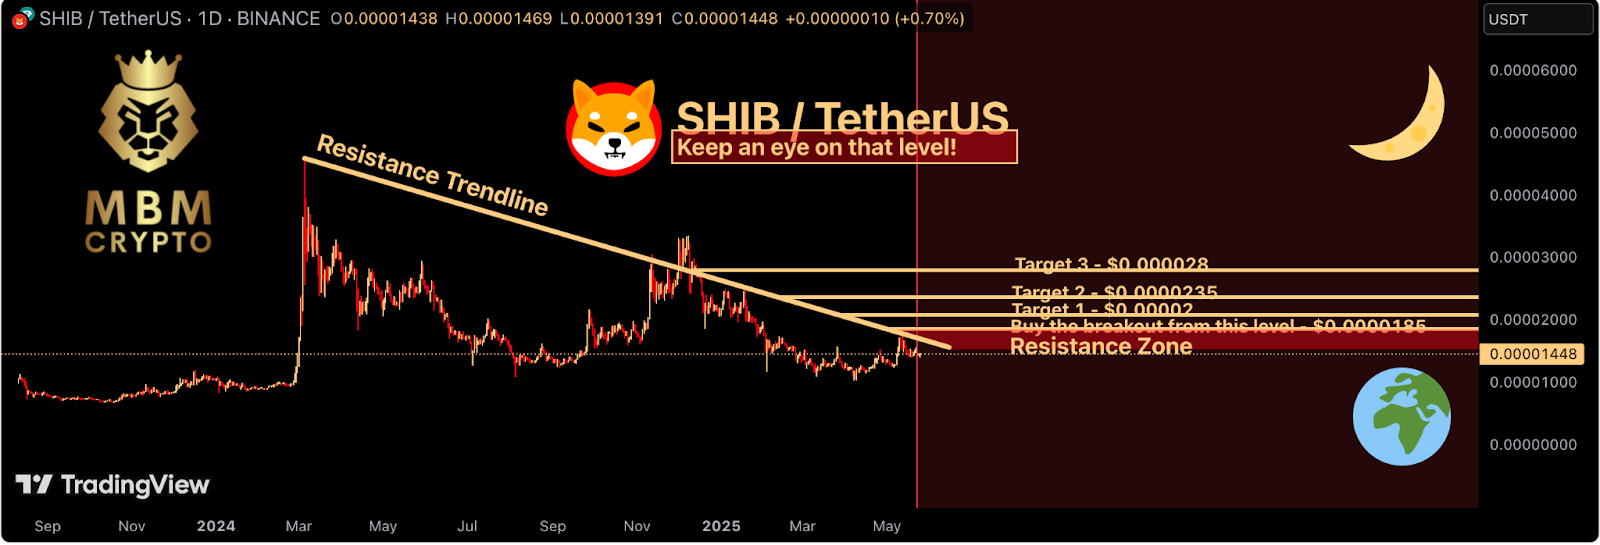
Following the drop, SHIB attempted a recovery, briefly touching $0.00003344 in December 2024 before retracing below trendline resistance. Another recent rejection occurred on May 12, when SHIB reached $0.00001734 but failed to sustain higher momentum.
According to MBM_Crypto, a confirmed breakout above $0.0000185 would invalidate the resistance and may trigger a rally toward three defined upside targets: $0.000020, $0.0000235, and $0.000028.
Meanwhile, technical analyst Jonathan Carter highlights that SHIB recently broke above the descending channel resistance with strong volume. Following the breakout, the price is currently retesting the 50-day moving average. Carter identifies bounce zones that could lead to successive targets at $0.00001730, $0.00002050, $0.00002420, and $0.00003230 if the MA 50 holds as support.
Support Retest and Wedge Formation
Adding to the broader technical picture, TradingView analyst Lingrid reports that SHIB is consolidating just above the $0.00001373 support level. This level sits at the intersection of an ascending trendline and a previous structure retest.
According to Lingrid’s chart analysis, this confluence area forms part of a wedge pattern that suggests waning selling pressure.

This wedge formation, if maintained, sets up a bullish breakout scenario. The analyst points to a primary resistance target of $0.00001727, which corresponds with earlier intraday highs within the resistance channel.
However, a breakdown below the trendline and a close under $0.00001350 would invalidate the bullish setup and potentially expose lower levels.
Lingrid recommends a buy entry at a zone between $0.00001350–$0.00001373, which would be activated when the price breaks out of the pattern. This area continues to play a key role in market direction because traders check for confirmation of the important breakout.
The Speculative Activity is at a Low
Long-term Shib supporters are on the rise, according to recent IntoTheBlock data. There are now 8.6% more addresses holding SHIB for more than one year, and these holders are approaching their record levels. Long-term investors are building their holdings even during uncertain moments, the data indicates.
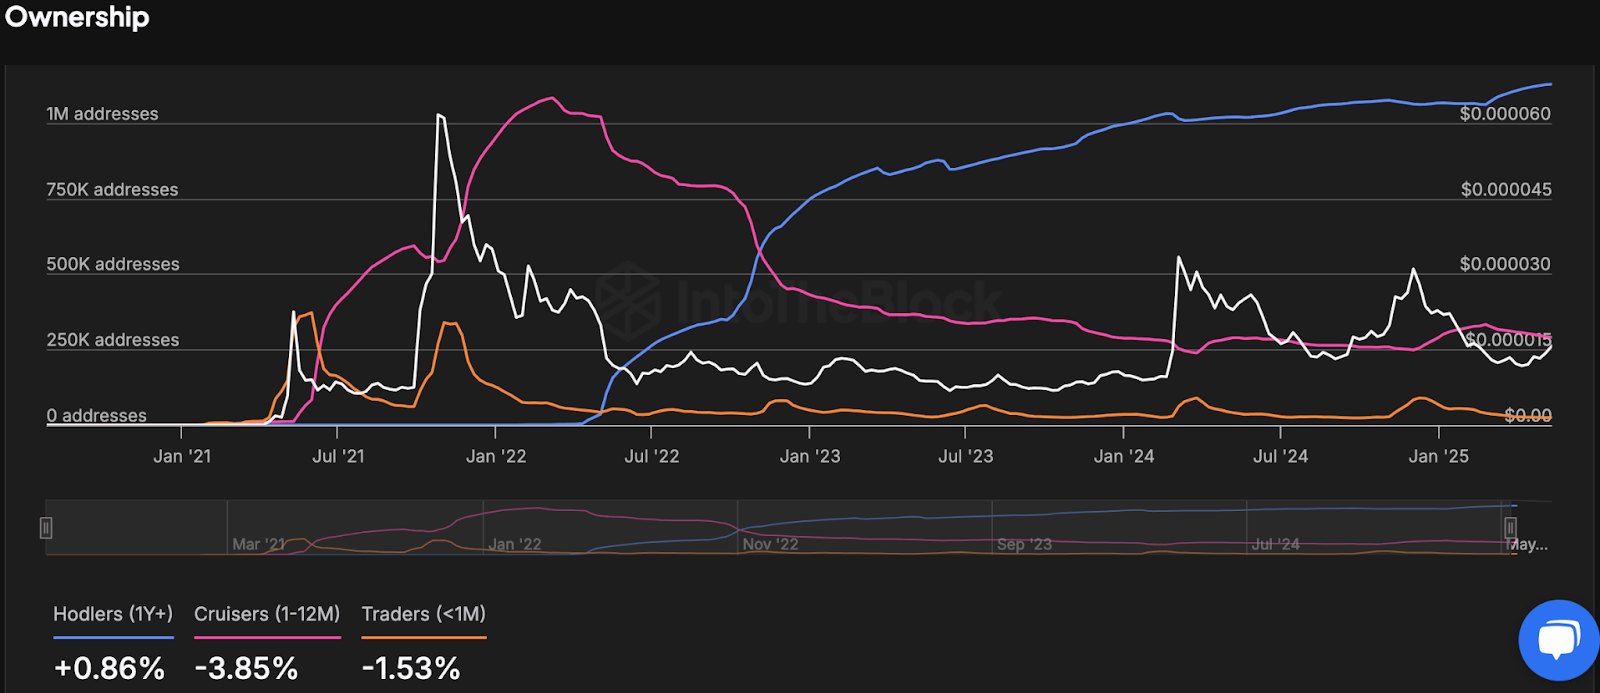
Alternatively, the percentage of mid-term holders, known as “cruisers” (1–12 months), has decreased by 3.85% since last year’s midpoint. Likewise, “traders” (anyone trading less than one month) have decreased by 1.53%. Address behavior shows that people are moving away from just buying and selling crypto to building a lasting base of holders.
If trading and cruising reduce, the selling pressure in the market could be reduced. The change also happened at the same time as the price consolidation between May 24 and May 26, proving that user actions impact market structure.
Disclaimer
In this article, the views and opinions stated by the author or any people named are for informational purposes only, and they don’t establish the investment, financial, or any other advice. Trading or investing in cryptocurrency assets comes with a risk of financial loss.