Bitcoin
 NEAR Protocol
 Pudgy Penguins
 Puffer
 ZKsync
 Bitway
 Pearl
Pearl

Key Insights:
- BlackRock, Fidelity, and Metalpha purchased over $96 million in Ethereum during the recent price dip.
- A Morning Star pattern on ETH/BTC mirrors its 2017 setup, suggesting a potential trend reversal.
- Chart signals show Ethereum retesting a historical support zone, followed by bullish candlestick formation.
Investment interest in Ethereum picked up as companies accumulated more ETH as the price dipped. Additionally, this pattern takes shape as Ethereum price chart mirrors the way it looked before its major rise in 2017.
BlackRock, Fidelity, and Metalpha Buy Over $96 Million in ETH
Notably, BlackRock and Fidelity have reportedly made substantial Ethereum purchases in recent days. A tweet from Ash Crypto indicated that BlackRock, which manages around $11 trillion in assets, acquired $35.2 million worth of Ethereum.

At the same time, CryptoGoos revealed that Fidelity Investments purchased 5,142.9 ETH, worth roughly $12.9 million. Such trends imply that accumulation by institutions is continuing while prices stay level.
Metalpha, a Nasdaq-listed company, made a major acquisition by purchasing 18,000 ETH valued at $48.45 million, as explained by @TedPillows. Blockchain data from the transaction showed a transfer from Binance’s hot wallet to a Gnosis Safe Proxy wallet associated with Metalpha.
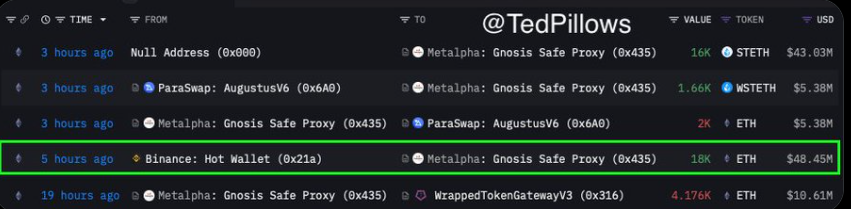
Consequently, this latest purchase pushed the total institutional Ethereum purchases this week up to $96 million. This suggests that the digital asset is gaining popularity with financial institutions.
Ethereum Price Morning Star Pattern Mirrors 2017 Structure
Meanwhile, crypto analyst CryptoGoos shared a chart comparing Ethereum price behavior relative to Bitcoin during 2017 and 2025. Both charts highlight a double-top structure near resistance levels, followed by a decline into a consolidation zone.
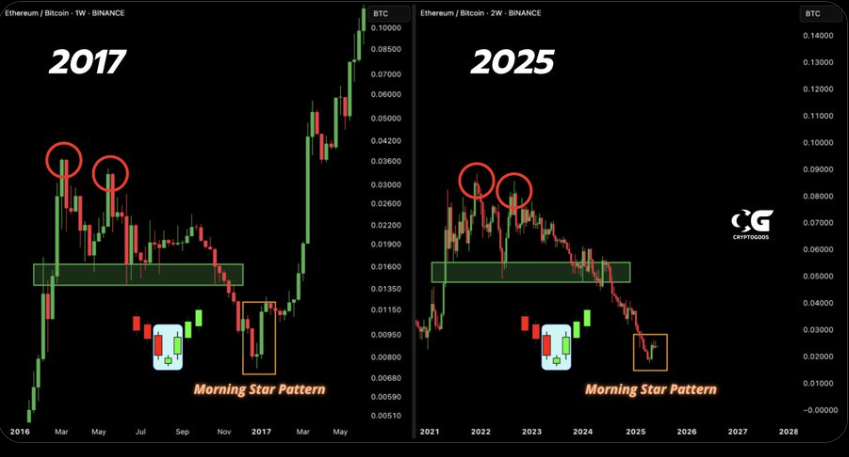
Additionally, a Morning Star pattern can be spotted beneath every correction zone. With this pattern accomplished in 2017, Ethereum price rose rapidly once the formation was complete.
According to the 2025 view, Ethereum price is recreating the setup. The Morning Star formation consists of three candles, one bearish, one indecisive, and one bullish. Notably, they are often interpreted by traders as a potential early sign of a price reversal.
Before Ethereum price surged against Bitcoin in 2017, this pattern was already established. Crypto Goos is keeping an eye on the current situation to determine whether the pattern will continue.
Ethereum Price Retests Support Zone
According to the technical analysis, Ethereum price is currently testing whether it can hold support against Bitcoin at a crucial level. This zone has historically acted as a support or bottom when the market turned after 2017 and 2025.
In addition, this structure is further supported by the absence of strong selling pressure during the pullback, which may indicate weakening bearish momentum. If the pattern holds, and price action confirms continuation, Ethereum could move into a phase of relative strength against Bitcoin.
Bullish Flag After Breaking Downtrend Channel
According to Peter Brandt, Ethereum recently broke out of a downward channel and may now be building a bullish flag formation. From the chart, it is clear that ETH broke past $2,150, enjoyed a strong rally, and is currently trading sideways with little movement. A flag formation over the breakout level can suggest the price might consolidate before resuming its rise.
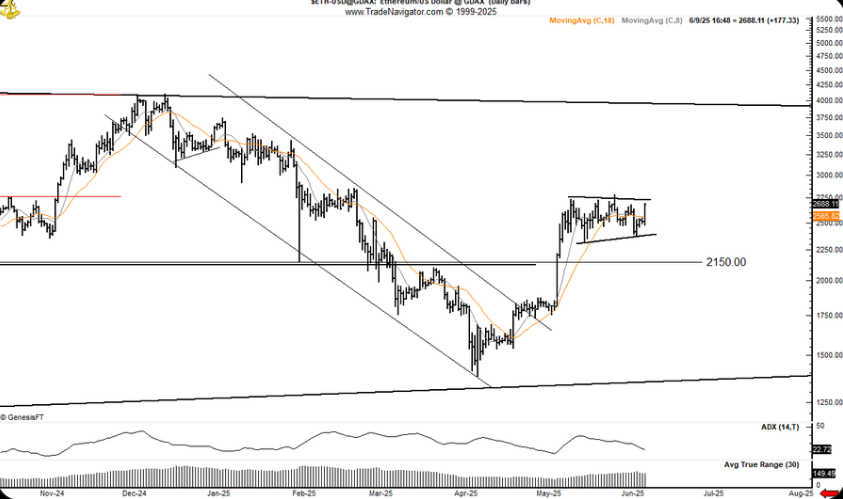
Moreover, the moving average lines (18-day and 9-day) are sloping upward, supporting bullish momentum. However, if ETH were to lose the lower trendline of the flag, a drop back toward the $2,150 level could occur.
Brandt’s caption, “Every dog has its day, woof woof $ETH,” implies he sees potential for Ethereum to resume its upward trend.
At the time of writing, Ethereum price traded at $2,691, up 7.5% in 24 hours with surging volume. Price broke above $2,650, signaling bullish momentum and continued short-term upward pressure.
Disclaimer
In this article, the views, and opinions stated by the author, or any people named are for informational purposes only, and they don’t establish the investment, financial, or any other advice. Trading or investing in cryptocurrency assets comes with a risk of financial loss.