Quantus
 Starknet
 Pearl
Pearl Celestia
 Injective
 Sui
Sui NEAR Protocol

Key Insights
- Tron (TRX) consolidates near $0.27 as breakout setup gains strength.
- Bollinger Band squeeze suggests incoming volatility for the TRON price.
- A successful breakout targets $0.29 in the coming sessions.
At the time of reporting, the Tron price hovered at $0.2769 as the token consolidated around the mid-range of its Bollinger Band. This level represented a technical equilibrium, often associated with a pause before a potential move. The mid-band, located near $0.27, emerged as a decisive pivot. A clear daily close above it could validate the start of a fresh bullish leg toward the $0.29 mark.
Earlier price action showed that TRX rebounded from the lower Bollinger Band near $0.26. That bounce attracted buy-side liquidity and pushed the price upward toward the 20-day simple moving average, also known as the mean line. If bulls closed above this mid-band with volume support, the upper Bollinger Band near $0.29 stood as the next resistance target.
Bollinger Band Squeeze Points to Volatility Expansion on Tron
The Bollinger Band formation indicates that there is such a thing as a tightening, or what is also known as a squeeze. Most often than not, this is followed by a broad expansion of volatility. It is not unusual that this tendency was the prelude to such trend-setter moves in the past.
In these types of squeezes, price does not stay whippy as it is compressed, and the result can create a bang to the market when there is a final breakout.
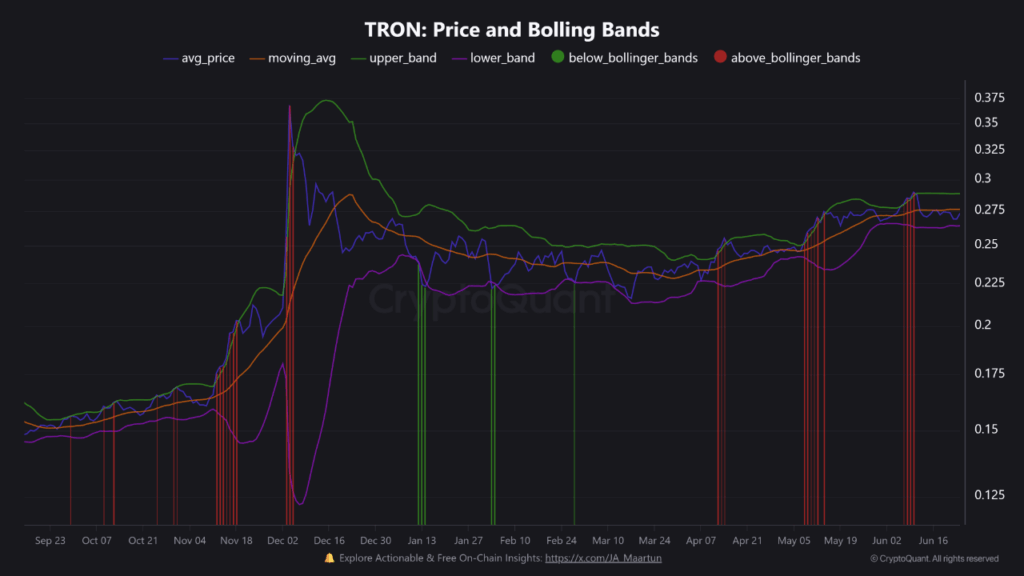
The past behavior of TRX in such cases displays that the price action that occurs when the width of Bollinger Bands is narrow is likely to bounce either up or down. This depends on the confirmation of volume and momentum. The existing arrangement is similar to earlier compression stages that took place in late November and mid-May, creating notable price advancements.
Currently, TRX, which has been struggling to recover recently, is stuck within the resistance and support levels of $0.27 and $0.26, respectively. The breach of the above $0.27 would be a good signal that there is positive momentum among buyers.
Technical Indicators Confirm Rising Breakout Probability for Tron
Looking at more charts, we see a bullish configuration with more solid footing, as it can be seen that there has been a rising wedge formation from mid-February to early June. The trend of rising wedges can be viewed as bearish reversal signals, but the breakage that followed seems to have support just above the price of $0.26.
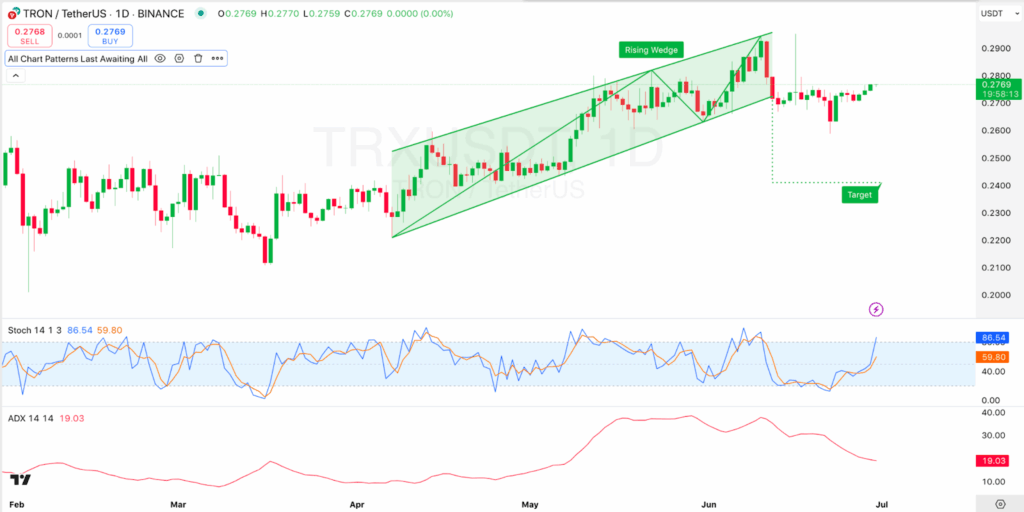
The stochastic indicator of RSI is in the overbought zone, with the %K showing 86.54 and %D at 59.80. This can often indicate short-term fatigue, but when the trend strength is in a high position, strong moves in the zone can open up to longer rallies.
Also, the ADX indicator at the moment is at the level of 19.03, informing about a weak trend, yet, a break above 20 might indicate an increase in the strength in the direction, especially taking into account the price dynamics that might indicate a breach of the upper resistance area.
The next logical price target, in case TRX, which has now flipped Dogecoin, can exceed the equilibrium zone at 0.27, is the upper Bollinger Band close to $0.29. This region has always been a distribution zone where profit-taking usually starts.
Nevertheless, a verified breach of this level, particularly at an escalated volume, may result in a long-lasting bullish leg.
Judging by the visual trend lines, in case of the continued increase and the staying of TRX above its short average, it is not only the upper Bollinger Band that will be achieved, but also the resistance at $0.30. The $0.29 area has been rejected severely in the last quarter, thus making it a critical zone in ascertaining the power of the current consolidation breakout.