Bitcoin
 ZKsync
 Pudgy Penguins
 Pearl
Pearl Quantus
 Starknet
 NEAR Protocol
Key Insights:
- Shiba Inu Coin price has formed the harmonic XABCD chart pattern on the weekly chart.
- It also forms a double-bottom pattern on the daily chart.
- Shiba Inu’s token burn and whale activity have increased this year.
Shiba Inu Coin price crashed to a crucial make-or-break support level this month. The token continued a downtrend in November last year. It has already plunged by 65% from that top point.
Short-term and long-term charts suggest a potential strong rebound. The key is for the SHIB price to maintain support at $0.00001035. This rebound will be supported by whale buying and the ongoing token burns.
Shiba Inu Coin Price Formed XABCD Harmonic Pattern on the Weekly Chart
The weekly timeframe chart shows that the Shiba Inu Coin price moved in an ascending narrow range between July 2022 and February 2024. Then, it finally broke out and reached a high of $0.00004565.
Since then, SHIB Coin has formed the harmonic pattern known as XABCD, pointing to an eventual comeback. This pattern is made up of four distinct phases, and it often resembles a butterfly when completed.
The XA section happened between March and August last year. At that time, the SHIB price dropped from $0.000045 to $0.000011. The bullish AB section follows this phase. This ended in November when it jumped to a high of $0.000033.
The next phase, BC, formed between November and where it is today, July 4. Therefore, the Shiba Inu Coin price will likely move to the next CD phase. It will rise from the current $0.000010 to $0.000045, approximately 300% above the current level.
The initial target for this price action is the B section at $0.000033, the highest level in November last year. It is also 200% above the current level.
The biggest risk that SHIB faces is if it drops below the current price of $0.000010. Such a move will invalidate the XABCD pattern and point to more downside.
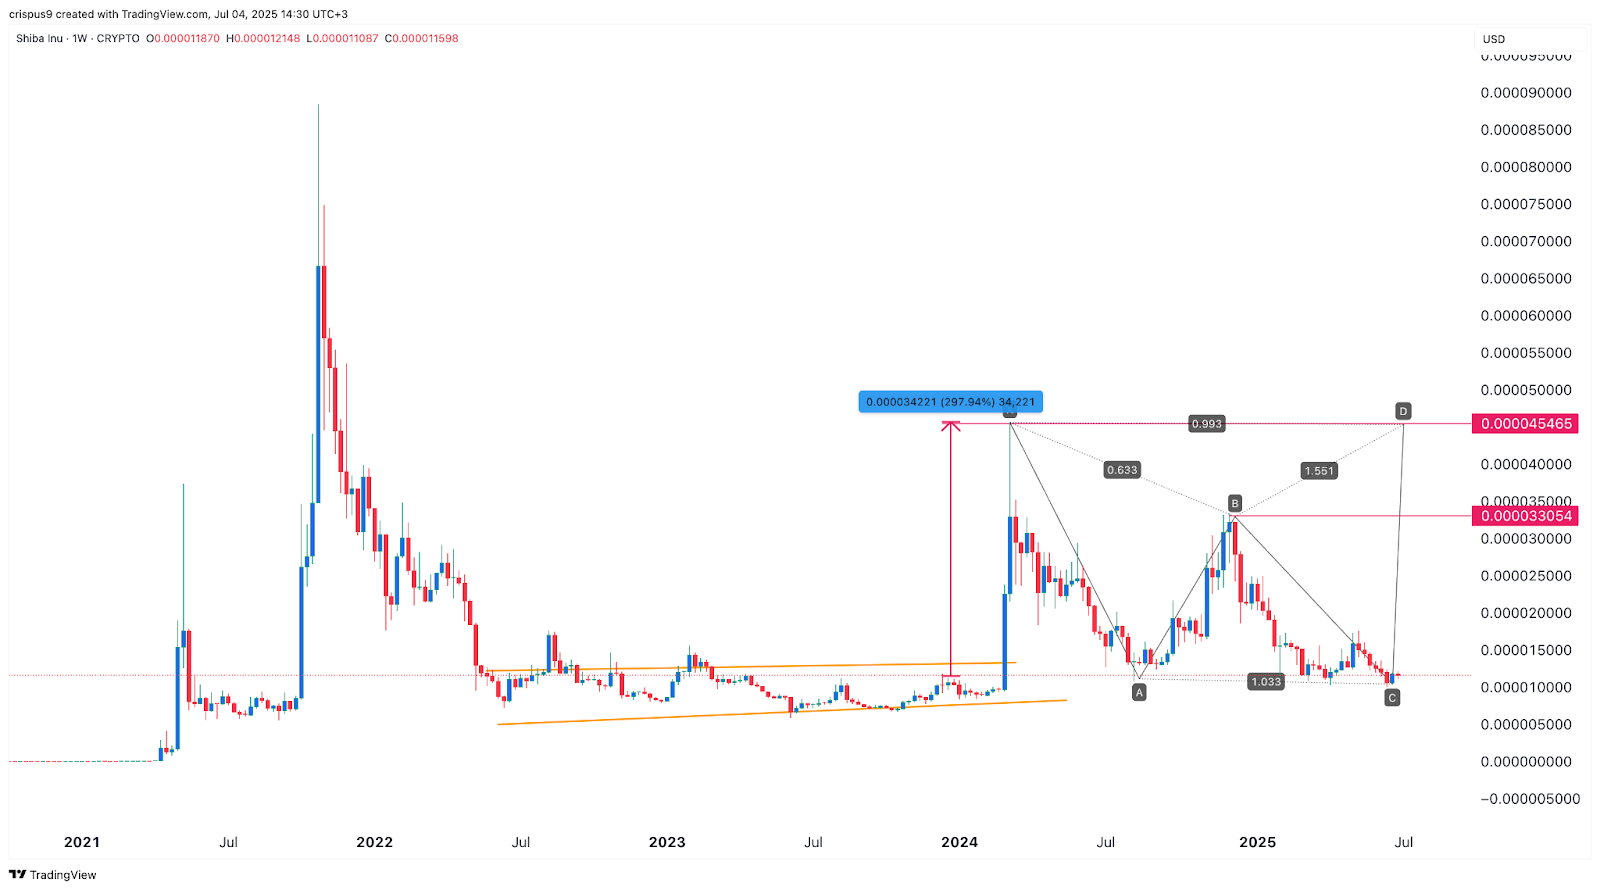
The main caveat with the XABCD pattern on the weekly chart is that its outcome often takes time. For example, moving from X to A took approximately three months, while moving from X to AB took four months.
SHIB Price Formed a Double Bottom on the Daily Chart
The daily chart also showed that the SHIB Inu Coin price has formed a rare and highly bullish chart pattern. It is known as a double-bottom.
This pattern comprises two distinct lows, which, in this case, are at $0.00001025. It also has a neckline at $0.00001758, its highest level in May this year.
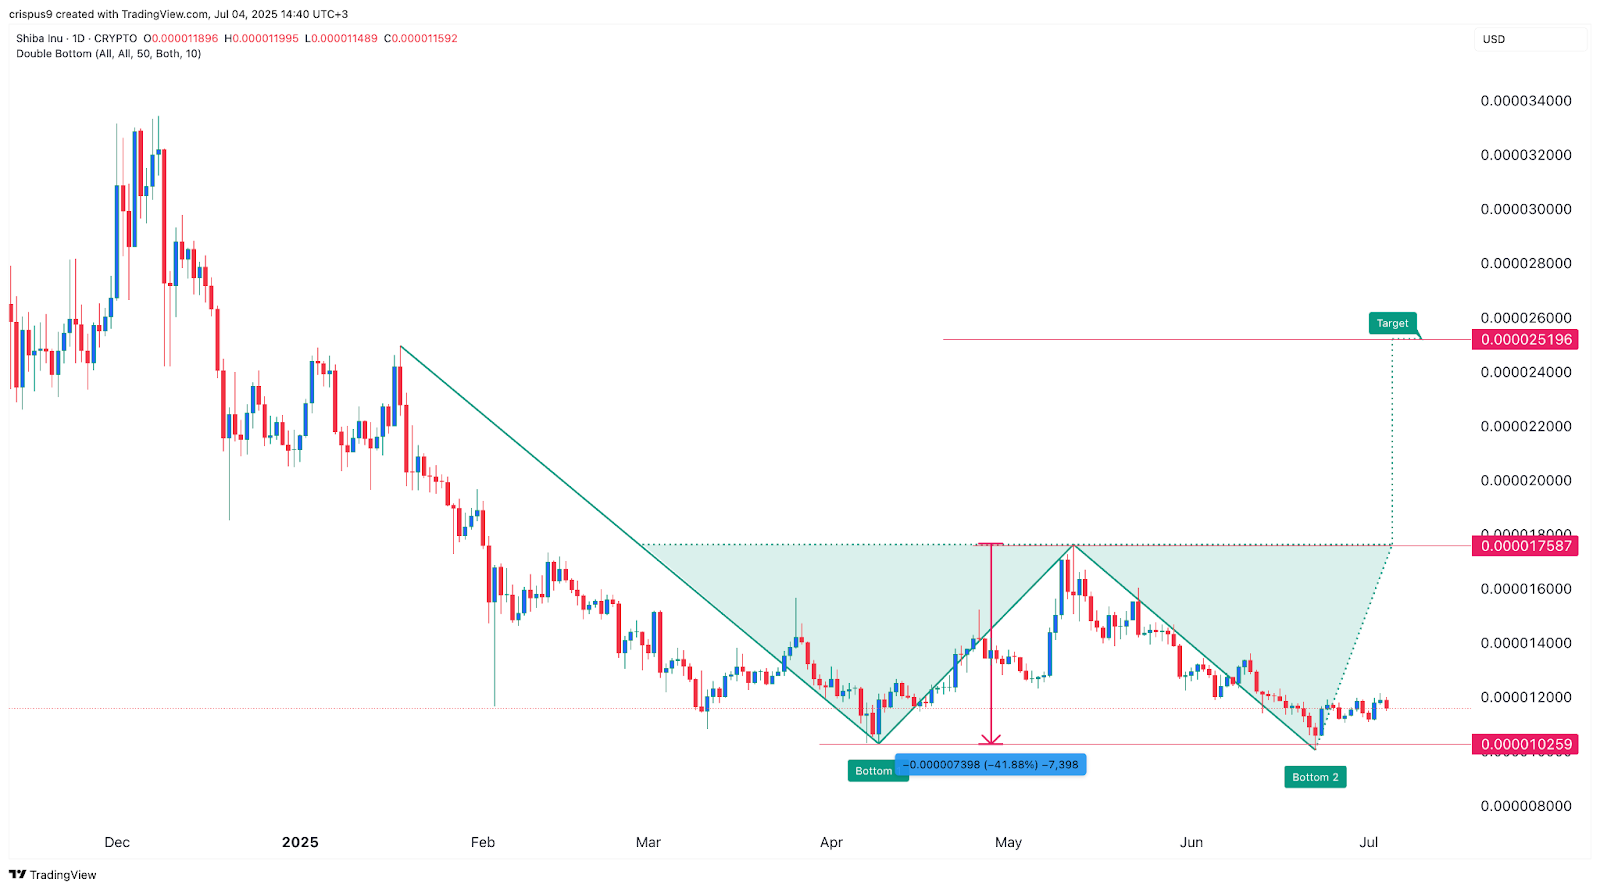
The double-bottom pattern also often leads to more gains over time. In this case, the profit target is estimated by measuring the double-bottom’s height and the same distance from the neckline.
The double-bottom pattern has a depth of about 41%. It measures the same distance from the upper side and gives the target at $0.000025, up by 115% from the current level.
Shiba Inu Burn Rate and Whale Buying
The potential crypto bull run is the main catalyst for the upcoming SHIB price rally. It will happen once the Bitcoin price breaks above its all-time high. A Bitcoin rebound often leads to more gains among altcoins like SHIB.
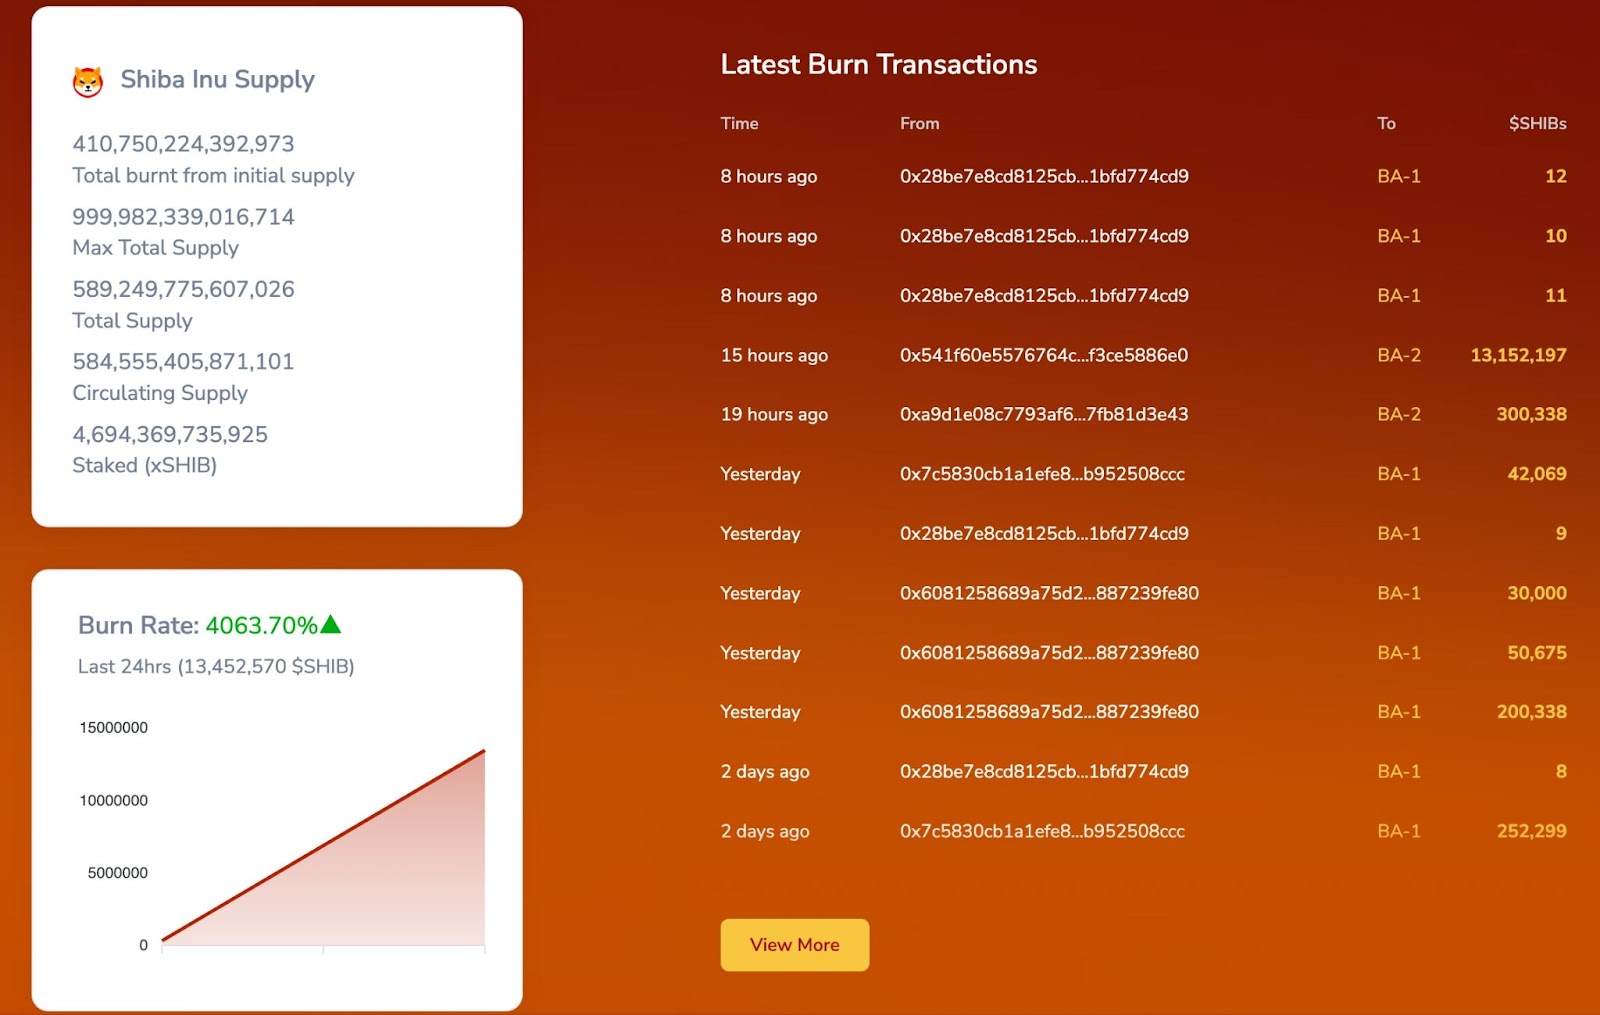
The other catalyst is that the Shiba Inu burn rate is soaring. It jumped by 4,063% on Friday, helped by a 13.15 million burn. The rising burn rate is bullish because it helps reduce the number of tokens in circulation.
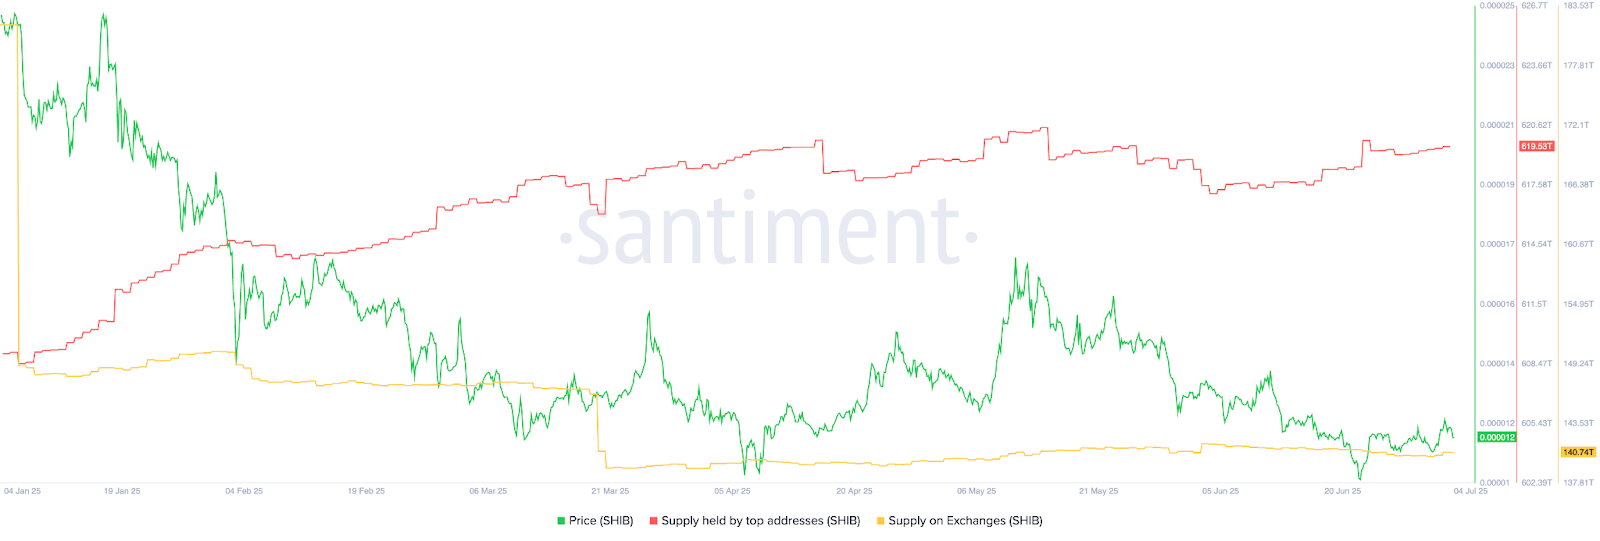
Furthermore, Santiment data indicates that whales have begun accumulating SHIB coin. It signals that they anticipate the Shiba Inu Coin price to rise.
The supply held by the top 100 addresses has jumped to 619 trillion tokens from 617 trillion in April. Also, the supply of SHIB in exchanges has been falling, indicating that the bearish capitulation has faded.
SHIB price has been in a strong downtrend for the past few months. The coin’s technical signals flash recovery potential, with a strong bullish harmonic pattern emerging on the weekly chart.
A confirmed double bottom on the daily chart suggests a trend reversal is underway. The ongoing token burns and whale buying will also boost it.
Disclaimer
This article is for informational purposes only and provides no financial, investment, or other advice. The author or any people mentioned in this article are not responsible for any financial loss that may occur from investing in or trading. Please do your research before making any financial decisions.