Bunker Mode
 Bitcoin
 Pearl
Pearl Starknet
 NEAR Protocol
 Wormhole
 Quantus

Key Insights:
- Dogecoin news confirmed a bullish MACD cross, indicating a potential 610% upside.
- DOGE Price retested $0.27 double-bottom neckline, offering a key support for next move.
- The breakout-retest pattern above $0.22 mirrors the 2021 surge structure, suggesting $0.70 soon.
Dogecoin news attracted renewed market interest after confirming multiple bullish technical signals. Analysts cited a DOGE breakout pattern, MACD crossover, and retest of a support level as the basis of a potential rally to $0.70. The market sentiment is shifting, with some charts resembling the bull cycle in 2021.
Dogecoin News Confirms Breakout Above Neckline
The latest Dogecoin news centered on a confirmed breakout above a long-standing resistance neckline around $0.27. Analyst Ali charts highlighted a double bottom formation between March and July 2025. This pattern created two higher lows before breaking out of the neckline, now a critical support level.
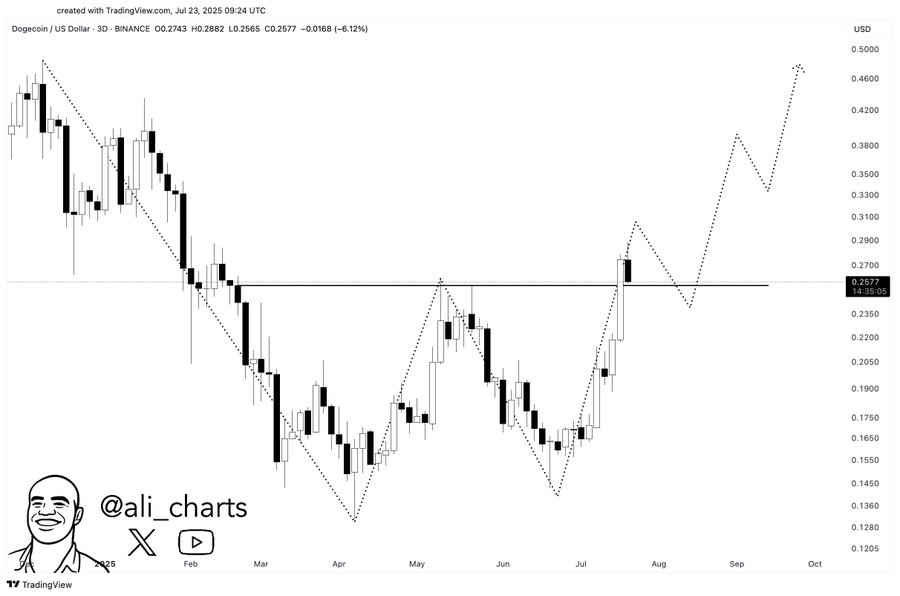
At press time, Dogecoin price was trading at $0.2577. The recent pullback is a retest of the breakout area, and analysts refer to it as a possible launchpad of the next step higher. If the $0.27 level holds, then there is a probability of a move towards the $0.40 or $0.50 levels soon.
This bullish pattern is typical of classic technical chart patterns before major uptrends. In the 2021 bull run, Dogecoin price executed a similar breakout from a symmetrical triangle and gained over 12,000% in months. Analysts believed the current setup may yield similar gains.
MACD Crossover Weekly Chart Suggests a 610% Surge
Furthermore, Bitcoinsensus identified a bullish MACD crossover on the weekly chart. This signal has historically predicted massive upward moves for the Dogecoin price. In 2023, the MACD cross preceded an 84% rally. In 2024, it triggered a 194% gain. By mid-2025, the third crossover drove a 446% surge.
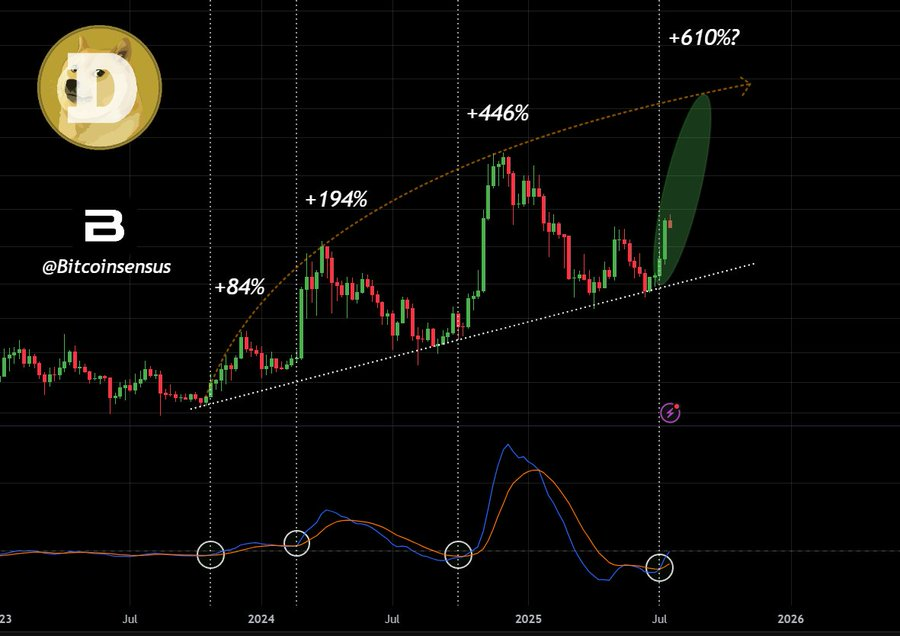
This fourth crossover could result in a 610% move, potentially pushing Dogecoin price to the $0.60–$0.70 range. MACD is a momentum confirmation indicator primarily utilized in crypto trading. The Dogecoin news compared the short-term and long-term moving averages to determine the change of trends.
According to Bitcoinsensus, the steepness of every rally increased with time. If the same pattern continues, this MACD cross may precede a rally in Dogecoin’s current cycle. The support trend line around $0.22 is a critical point to support this view to continue to hold.
Meanwhile, the convergence of MACD and structural breakout setups further reinforces the bullish scenario. The increase in volume and the sentiment in social media also indicated a growth in investor trust regarding the meme asset.
Breakout-Retest Pattern Repeats 2021 Setup
Analyst JD posted a long-term Dogecoin chart with price following a textbook breakout-retest pattern. Between 2018 and 2021, Dogecoin’s price traded in a symmetrical triangle until the top memecoin exploded into a strong rally. That Dogecoin news cycle completed near $0.73, DOGE all-time high.
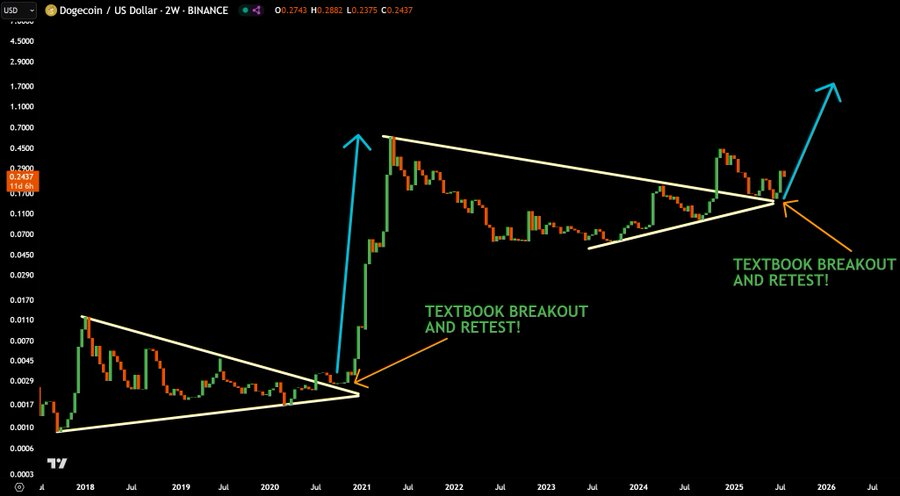
The present cycle seemed to repeat itself. Dogecoin price recently broke out of a multi-year triangle and has now retested the breakout trendline. JD underlined how these patterns are uncommon and strong, and how they typically create life-changing moves of the early entrants.
He also warned against explosive runs that were followed by sharp corrections. After its 2021 peak, Dogecoin price crashed by over 90%. Although the bullish momentum can prevail in the current period, there is risk after new highs are established.
Nonetheless, the current Dogecoin news closely mirrors the pre-2021 setup. With historical precedent supporting this model, traders are preparing for possible continuation toward $0.50–$0.70 levels if momentum builds
Pullback to $0.260–$0.265 Offers Near-term Accumulation
BitGuru also introduced a short-term outlook, where indicators of an approaching pullback were also noticed. According to his Dogecoin news, DOGE price rallied from $0.17587 to a peak of $0.28667 before showing resistance. The market has shown a tendency towards consolidation, and the area around 0.260-0.265 may serve as the possible re-entry position.
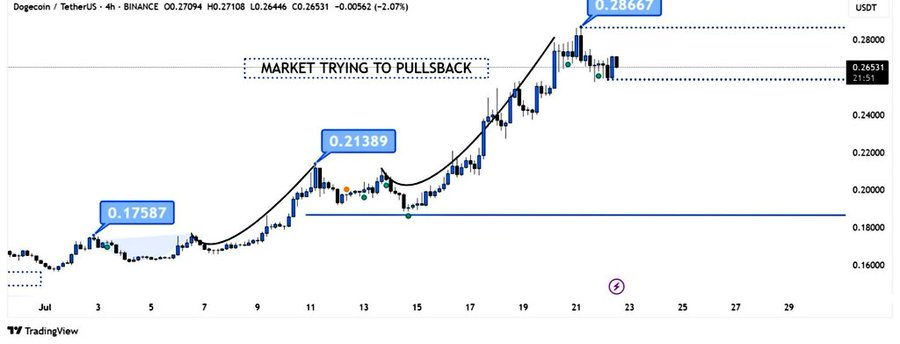
The chart marked major price levels, such as, $0.21389, where historical resistance became support. Bulls must defend these zones to prevent further downside. If successful, further purchases may be aimed at the short-term target of $0.35 to $0.40.
Despite temporary weakness, the broader bullish structure remains intact. Several timeframes have continuation patterns, and MACD and double-bottom signals remain significant.
If the buyers intervene at this consolidation phase, the next impulse may be set at that level of $0.70.
Disclaimer
This article is for informational purposes only and provides no financial, investment, or other advice. The author or any people mentioned in this article are not responsible for any financial loss that may occur from investing in or trading. Please do your research before making any financial decisions.