Claudia
 Crawlerpad
 Bunker Mode
 Starknet
 Pearl
Pearl Quantus
 Pudgy Penguins

Key Insights:
- Ethereum priis testing the top of a multi-year triangle, with a projected breakout target near $8,000.
- The Altseason Index has broken a 2025 downtrend, rising from 25 to 29, signaling early altcoin momentum recovery against Bitcoin.
- Bitcoin dominance falls while ETH and mid-cap altcoins gain share, indicating structural capital rotation.
Ethereum (ETH) price was approaching a key resistance level that may determine its next directional move. Market data and technical patterns showed that ETH could soon reach $8K if a breakout occurs. Meanwhile, altcoin metrics and capital shifts reinforced growing strength in the wider digital asset market.
Ethereum Price Approaches Multi-Year Triangle Resistance
Notably, Ethereum price tested the upper side of a symmetrical triangle pattern that has established itself over the last three years. Analyst Titan of Crypto noted this technical formation, and it has accumulated since the cycle high of 2021. Additionally, it was a succession of lower highs and higher lows on the monthly ETH/USD chart.
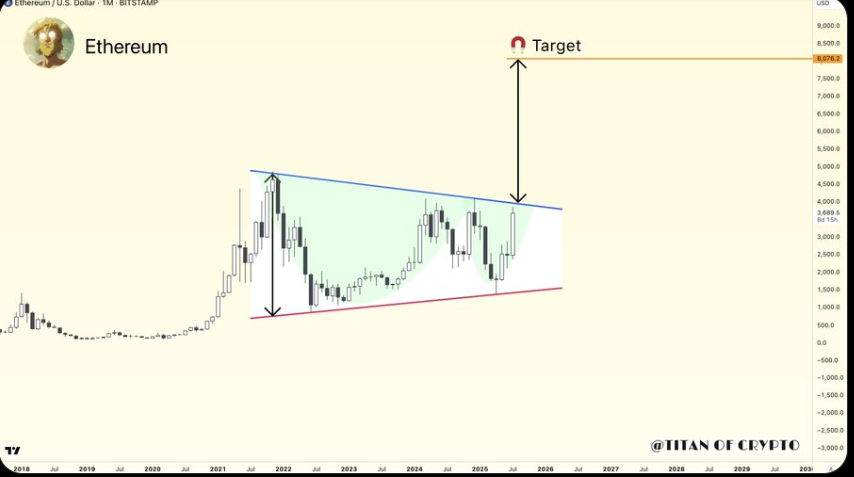
By July 2025, the Ethereum price was trading around the descending resistance of this triangle, which has been a critical ceiling in the past. The triangle’s height indicated a possible move towards about $8K when Ethereum price breaks out.
Consequently, a confirmed breakout would initiate a fresh bullish phase, possibly triggering renewed capital inflows into Ethereum and related altcoins. This chart setup coincided with broader developments across the altcoin sector.
Additionally, Ethereum price momentum has increased throughout the second quarter of 2025, gaining over 30% from its local bottom. Trading volume and open interest in derivatives have also risen, suggesting growing market participation.
Altseason Index Signals Early Market Shift
Recently, the Altseason Index, from BlockchainCenter.net, has indicated early on that recovery was possible. The altcoin index gauges the performance of altcoins against Bitcoin.
In July 2025, it gained 25 to 29, leaving the “Bitcoin Year” region, in which Bitcoin performed relatively well. Any reading that exceeded 50 was historically the confirmation that altcoins were leading the market recovery.
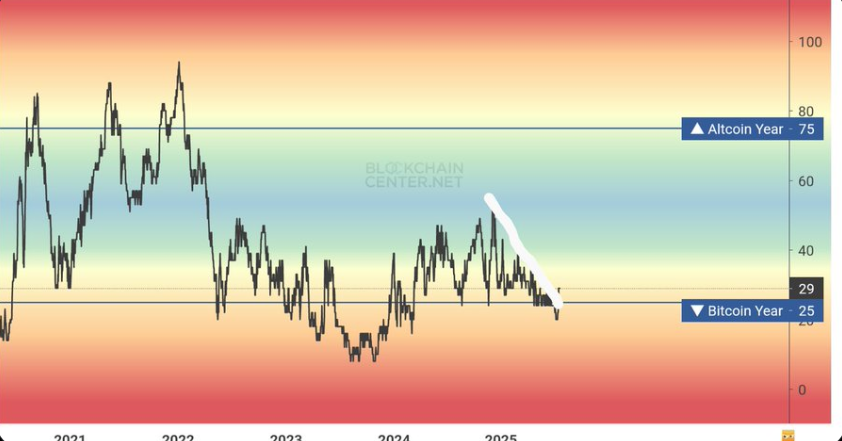
Notably, the index had been experiencing a long-term downtrend throughout the year. Nevertheless, the latest price action indicated a negative break above this trendline, which indicates a change in sentiment towards altcoins.
Historical patterns indicated that these breakouts tend to be followed by an extended bullish period in which altcoins, such as Ethereum, dominate. This trend aligned with the technical arrangements found on Ethereum and some mid-capped tokens.
Key Resistance Level Could Trigger Altcoin Breakout
Another analyst, Carl Moon, shared a chart showing the TOTAL3/BTC ratio, emphasizing a descending support structure that acted as a base throughout 2023 and 2024. The recent bounce from the 0.25 region marked a shift in altcoin momentum, with the ratio currently trading near 0.38 after a 46% rise from its bottom.
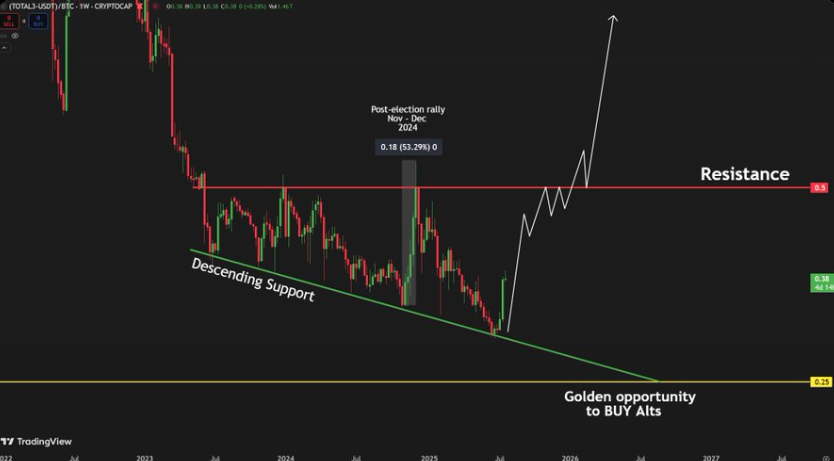
Intriguingly, the chart marked 0.5 horizontal as a major resistance level. The area had already dismissed an earlier rally in late 2024. A successful break above resistance may result in an extended uptrend in altcoins and timelines with higher highs and bullish reversal patterns common in an altseason.
Bitcoin Dominance Weakens as Rotation Begins
Meanwhile, Bitcoin’s market dominance has been declining steadily in recent weeks, with capital beginning to shift toward Ethereum and mid-cap altcoins. The BTC dominance index has broken down from key levels on multiple relative strength charts.
Previous cycles show that steep drops in Bitcoin’s share of market capitalization often coincide with rising demand for alternative digital assets.
Notably, a chart from Swissblock’s Altcoin Vector framework reveals a clear decline in Bitcoin’s strength index, while Ethereum and other top altcoins gain market share. This structural adjustment signaled a redistribution of capital and is historically a precursor of periods when altcoins outpace Bitcoin.
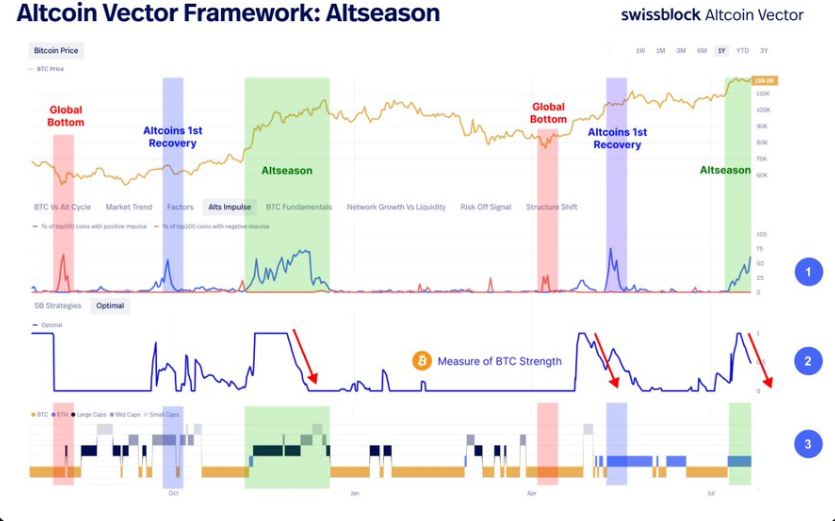
Moreover, this trend mirrored past altseason set-ups in which Ethereum has dominated the initial phase of capital rotation. Over 60% of the top 100 coins showed bullish signals. This aligned with prior altseason patterns, where market breadth expands in favor of altcoins once Ethereum outperforms Bitcoin.
Disclaimer
This article is for informational purposes only and provides no financial, investment, or other advice. The author or any people mentioned in this article are not responsible for any financial loss that may occur from investing in or trading. Please do your research before making any financial decisions.