Minter
 Quack AI
 NEAR Protocol
 Sui
Sui Hyperliquid
 Cardano
 Raydium

Dogecoin (DOGE) price has displayed positive uptrend action in the last few weeks, trading with mild ascending action towards resistance levels. The meme coin went up more than 15% in August, with the help of both market conditions and technical patterns.
Dogecoin Price Technical Patterns Indicate Bullish Momentum
One of the notable technical formations on the 4-hour chart is a bull flag, which indicates potential continued Dogecoin price rally. This trend indicates a rally, in which the meme coin went through a consolidation period before resuming its trend of increasing value.
As DOGE price narrows down in this trend, the second price target might be at $0.35, which has been a resistance in previous trends. Furthermore, the bull flag pattern indicated the possibility of building further upside on its development.
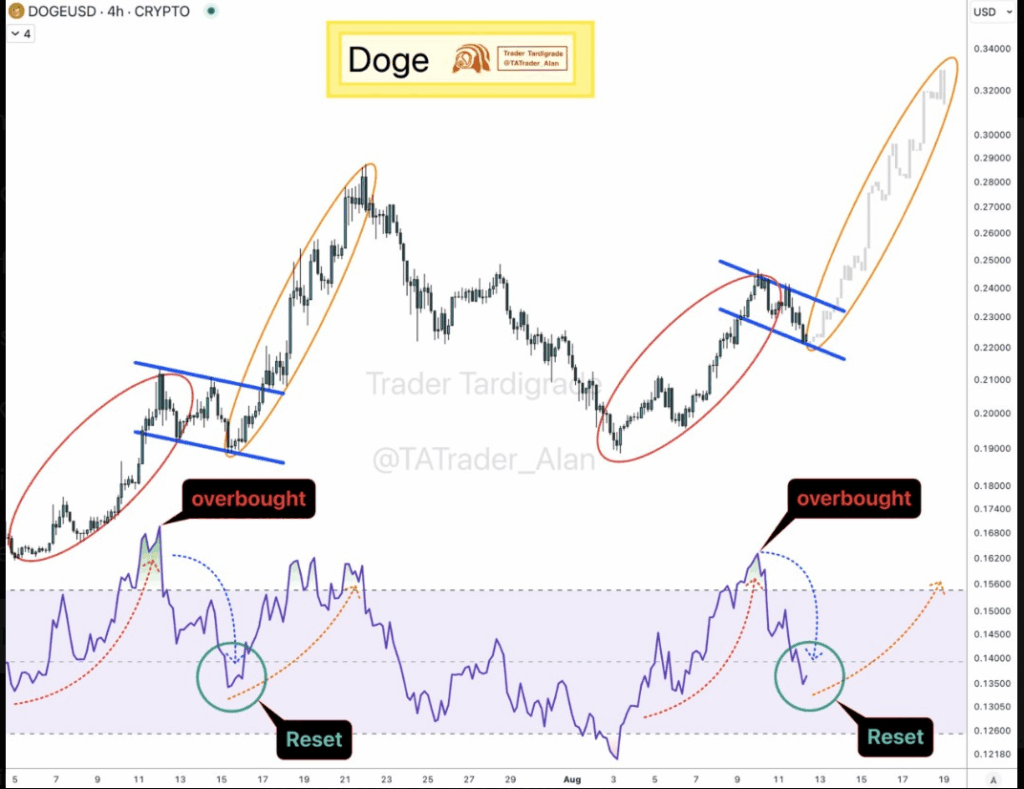
As Dogecoin price holds above key support levels, the top meme coin is preparing for a continuation of its bullish trend.
The analyst also referred to Dogecoin’s Relative Strength Index (RSI) falling below the 50 mark, which marks the reestablishment of balance after the overbought condition. When RSI becomes overbought, this shows that there is a likelihood that the price may pull back.
But because the RSI is less than 50, this indicates that the market is calming down and there can be a consolidation before we get the next surge up. The new direction of the price following this reset should be more stable, as buyers get back in.
Dogecoin Price Double Bottom Formation
Further, a double bottom pattern on the Dogecoin chart was formed, which is yet another evidence of the possibility of further bullish movement. This is a technical pattern as defined by two consecutive troughs at approximately the same price level, creating a formidable support level.
The trend represents a bullish reversal pattern, and thus, once the second bottom is made, the meme coin price might soar above the resistance line.
The analyst noted a double bottom pattern on Dogecoin at $0.15 and $0.16. DOGE price depicted this steady increase since the second bottom was formed at the end of June and in July.
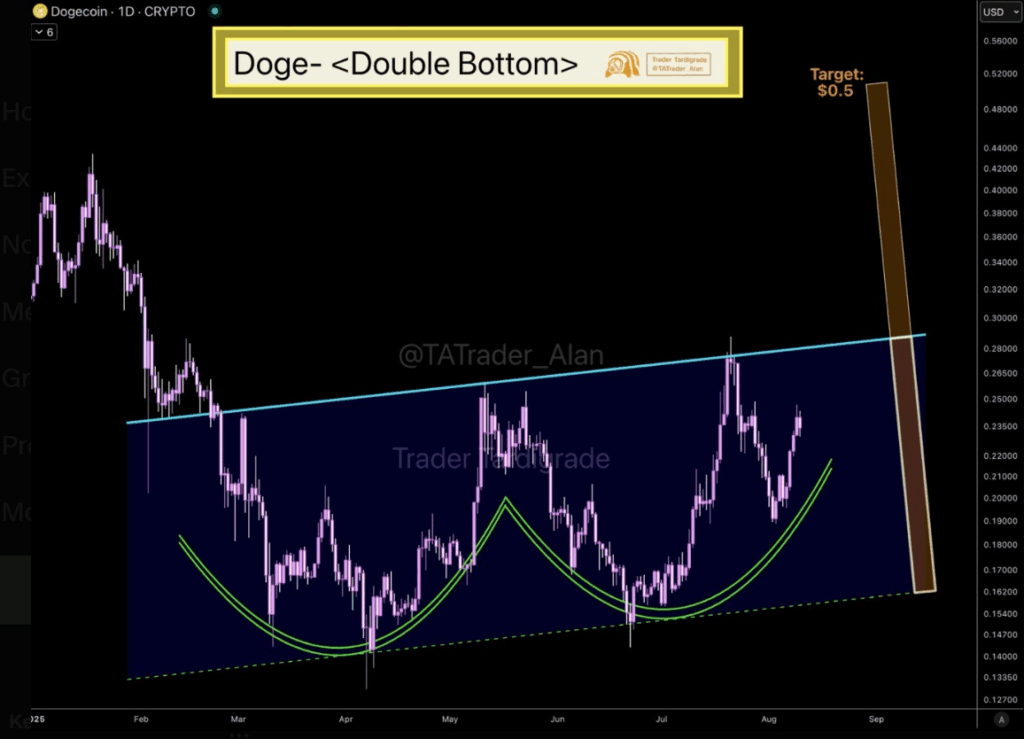
The breakout of this trend is currently at $0.50, a value calculated by measuring the distance between the two bottoms and scaling it upwards.
Inverse Head and Shoulders Pattern and Resistance Levels
Another bullish technical pattern that reinforces the bullish potential of the DOGE price is an inverse head and shoulders (iH&S) pattern, which is currently forming on the 4-hour chart. This formation is made up of the left shoulder (LS), head (H), and the right shoulder (RS) with the meme coin anticipated to break above the neckline after clearing resistance.
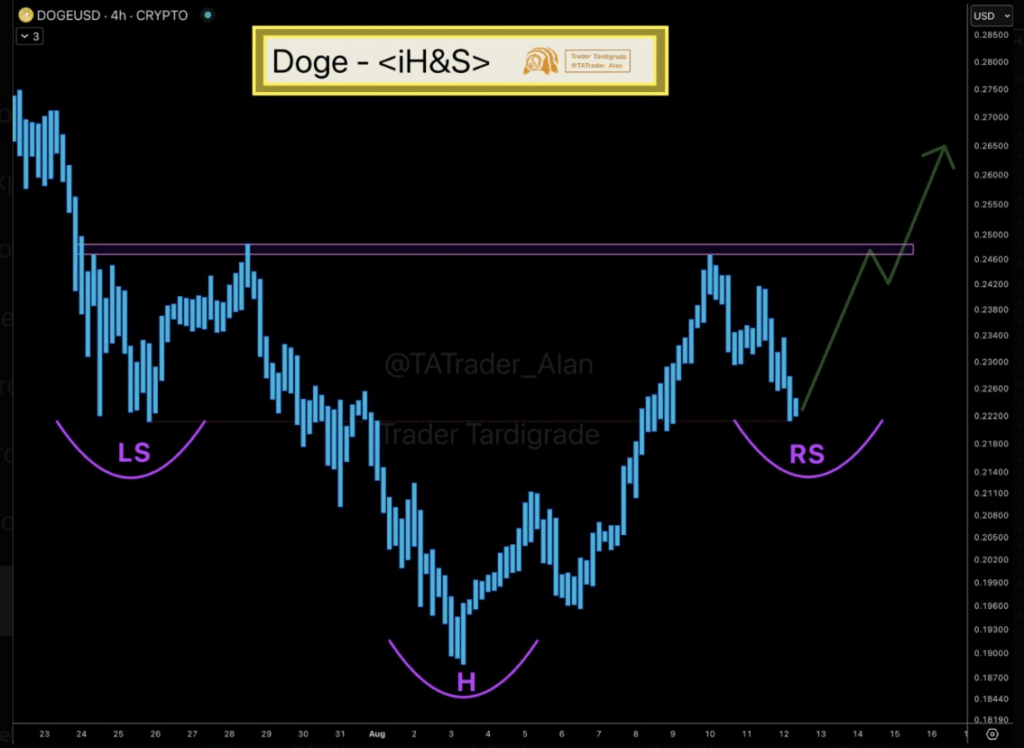
The neckline of this pattern is around the level of $0.2460, which is a very important level of resistance. As soon as this barrier is taken, DOGE price may rally to the next resistance level.
With Dogecoin still in the uptrend, the price will likely form new points of resistance, with the short-term target set at around the $0.35 region. At the time of press, the meme coin stood at a price of $0.2245, meaning it had gained 11% in just 7 days.