
 streamoors
 Altai the Tiger
 Sword Inu
 IGNITION
 no crying in the casino
 Quantus
 NEAR Protocol

Key Insights:
- Bitcoin closed August at $108,269 as MVRV showed a death cross.
- Analysts are split on whether the signal marked a peak or a correction.
- Other metrics, including NVT and miner reserves, pointed to strength and sustained price breakout.
Bitcoin’s price closed in August 2025 above $108,000, but momentum weakened as the Market Value to Realized Value (MVRV) ratio showed a death cross.
Analysts said the move signaled slowing strength, though other on-chain measures suggested the bull market had not fully ended.
Bitcoin MVRV Death Cross and What It Means
Bitcoin’s momentum slowed after the MVRV ratio showed a death cross in late August.
Based on Cryptoquant analysis, the death cross came as the 30-day Moving Average dropped below the 365-day average.
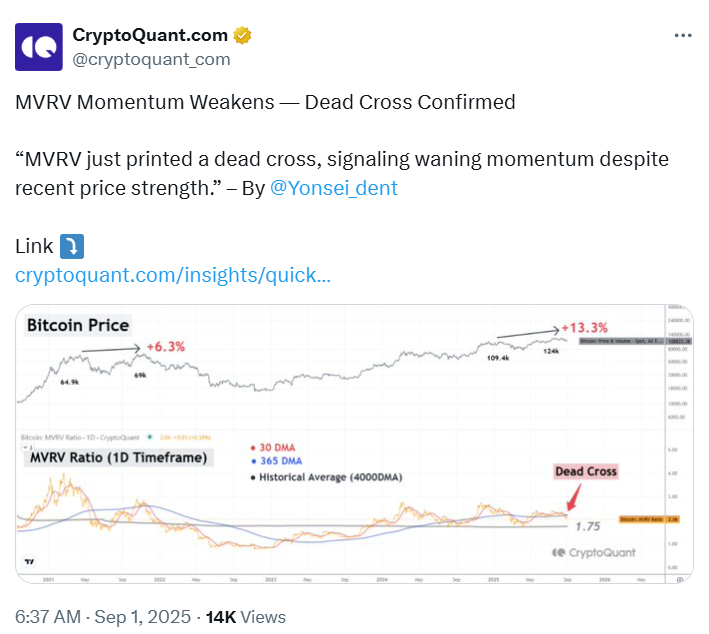
Similarly, analysts said this was a sign that short-term inflows were not keeping up with longer-term levels.
The MVRV ratio compares the market value of Bitcoin with its realized value. Realized value measures the overall cost at which coins were last moved.
Traders often used MVRV to judge if Bitcoin was overpriced or underpriced. When the short-term average crossed below the long one, it pointed to weaker demand.
The last time Bitcoin saw a similar pattern was in 2021. Then, the price rose from $64,900 to $69,000, but MVRV was already falling.
This year, the price of Bitcoin rose from $109,400 to $124,000, yet MVRV again turned down. Analysts said this showed price gains were not fully backed by new money.
The signal came just after the Bitcoin price passed $100,000 in July. MVRV showed a death cross above that level for the first time in this cycle.
Analysts See Mixed BTC Signals
The MVRV signal sparked debate as some analysts believed the death cross showed the market was near a peak.
It is important to add that others said it was part of a normal correction in a longer bull run.
In addition, on-chain data supported both takes. The Network Value to Transactions (NVT) ratio, which compares market size with network use, stayed below 50 since early July.
According to the onchain trends, analysts said the level pointed to strong activity on the blockchain.
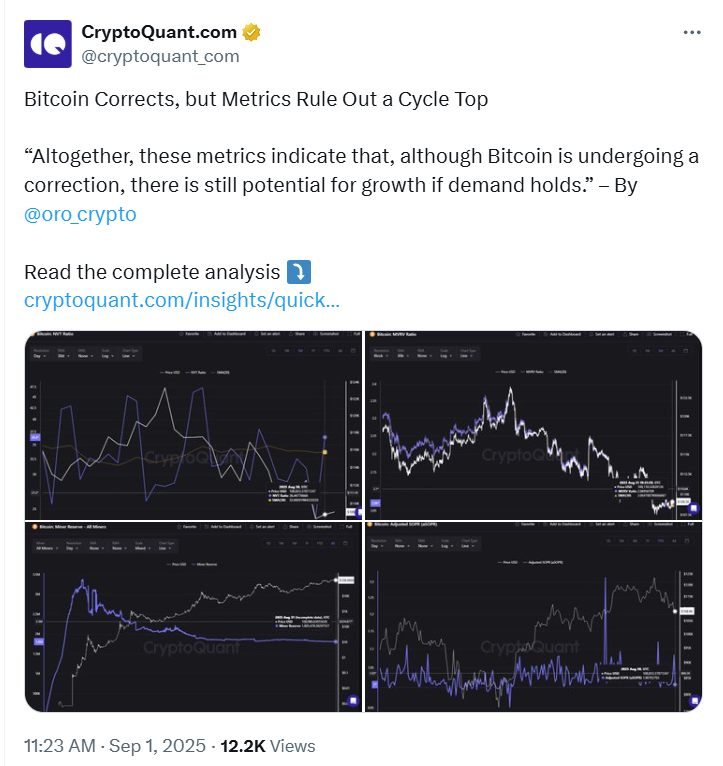
Long-term holders were still adding coins, while reserves on exchanges kept dropping.
Furthermore, this suggested less selling pressure. Miner reserves stood at about 1.805 million Bitcoin, with only 6,000 BTC sold this year. Miners often sold far more in earlier cycle tops.
Another sign was the Adjusted Spent Output Profit Ratio (aSOPR), which stayed above 1, meaning most coins moved were in profit.
Still, analysts said this showed coins were being sold at gains, but levels had not reached the overheated stage seen in past tops.
Looking at both, the signals painted a mixed picture. Momentum slowed, but broader data did not confirm a final peak.
PlanB Notes Uptrend Still in Place
PlanB, a Bitcoin analyst known for creating the Stock-2-Flow models, also updated Bitcoin’s outlook. He said the Bitcoin price closed in August at $108,269.
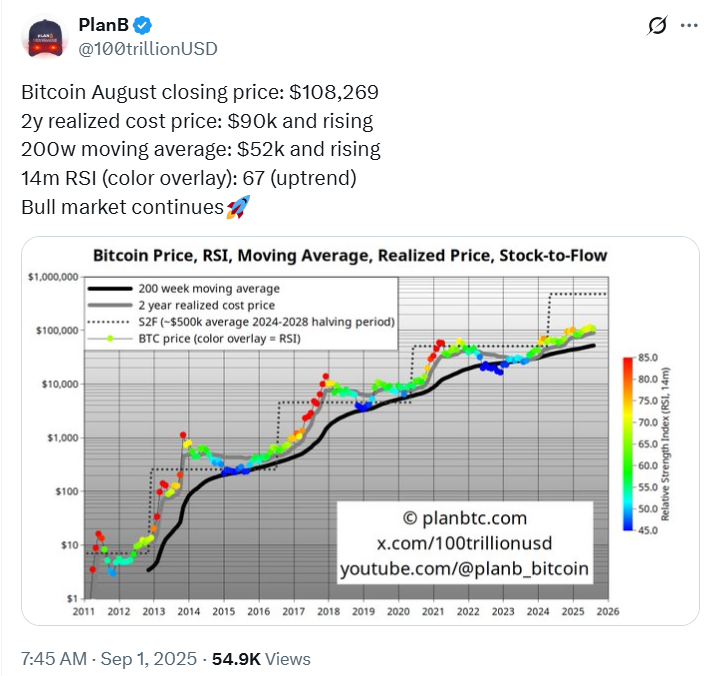
He noted that the two-year realized cost price is pegged at $90,000 and rising. The 200-week moving average stood at $52,000 and also moved higher.
PlanB also pointed to the 14-month Relative Strength Index, an indicator that measures momentum.
It read 67, which placed it in an uptrend. The analyst noted that this showed the larger bullish trend is still strong.
Charts shared by PlanB showed Bitcoin’s path still aligned with the stock-to-flow model. This suggested the bull market could continue even with short-term weakness.
Bitcoin’s August performance highlighted the split in signals. The MVRV death cross showed cooling demand, but other indicators pointed to support.
With Bitcoin above $108,000, traders and analysts were watching closely to see if the market would turn lower or push higher again.
As of the time of writing this piece, the Bitcoin price was trading at $108,674.49, down by 3.56% in the last seven days.
Disclaimer
This article is for informational purposes only and provides no financial, investment, or other advice. The author or any people mentioned in this article are not responsible for any financial loss that may occur from investing in or trading. Please do your research before making any financial decisions.




